RPI3 POWER METER
TRIXIE POWER METER
+ + Node-Red to INFLUXDB
+ + INFLUXDB to GRAFANA
RPI3 online
we come from
RPI newest OS Debian Trixie
and while the RPI4 is just ready to get started with a pending project ( RPI PICO W analog out poti style )
i make a other new setup
TRIXIE POWER METER
just using some old parts:
on a
RPI3 ( using UGREEN adapter TEAM SSD 120GB )
install Raspberry Pi OS desktop 64bit and
Mosquitto and
NodeRed ( like i do for RPI4 )
and connect via MQTT my
SONOFF S31 Power meter/switch flashed with TASMOTA
link the S31 to RPI3 wifi Mosquitto MQTT-broker
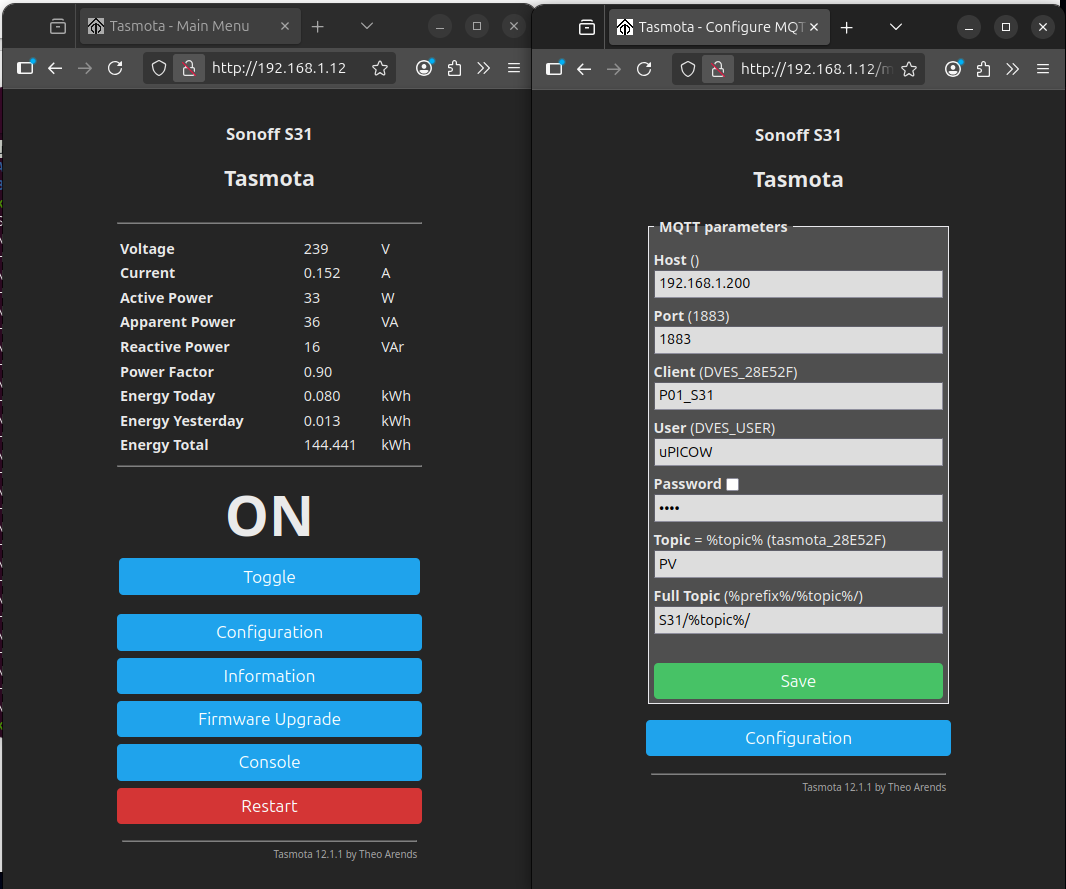
make a minimal MQTT in of the ENERGY meter
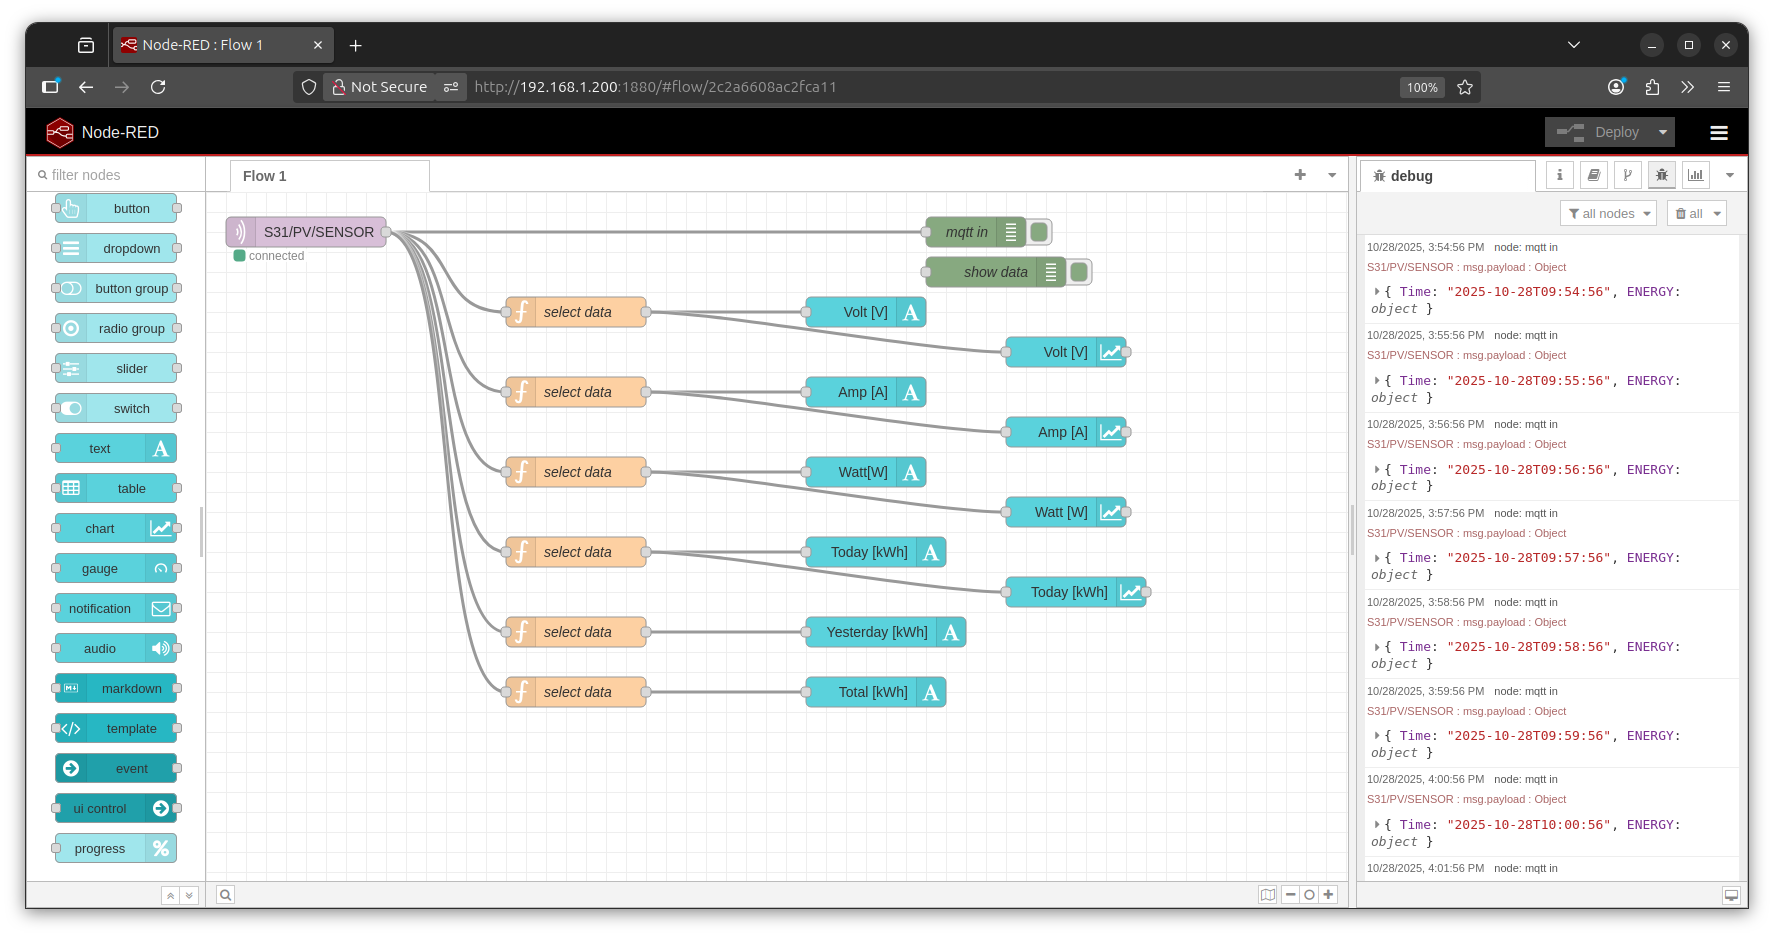
send to
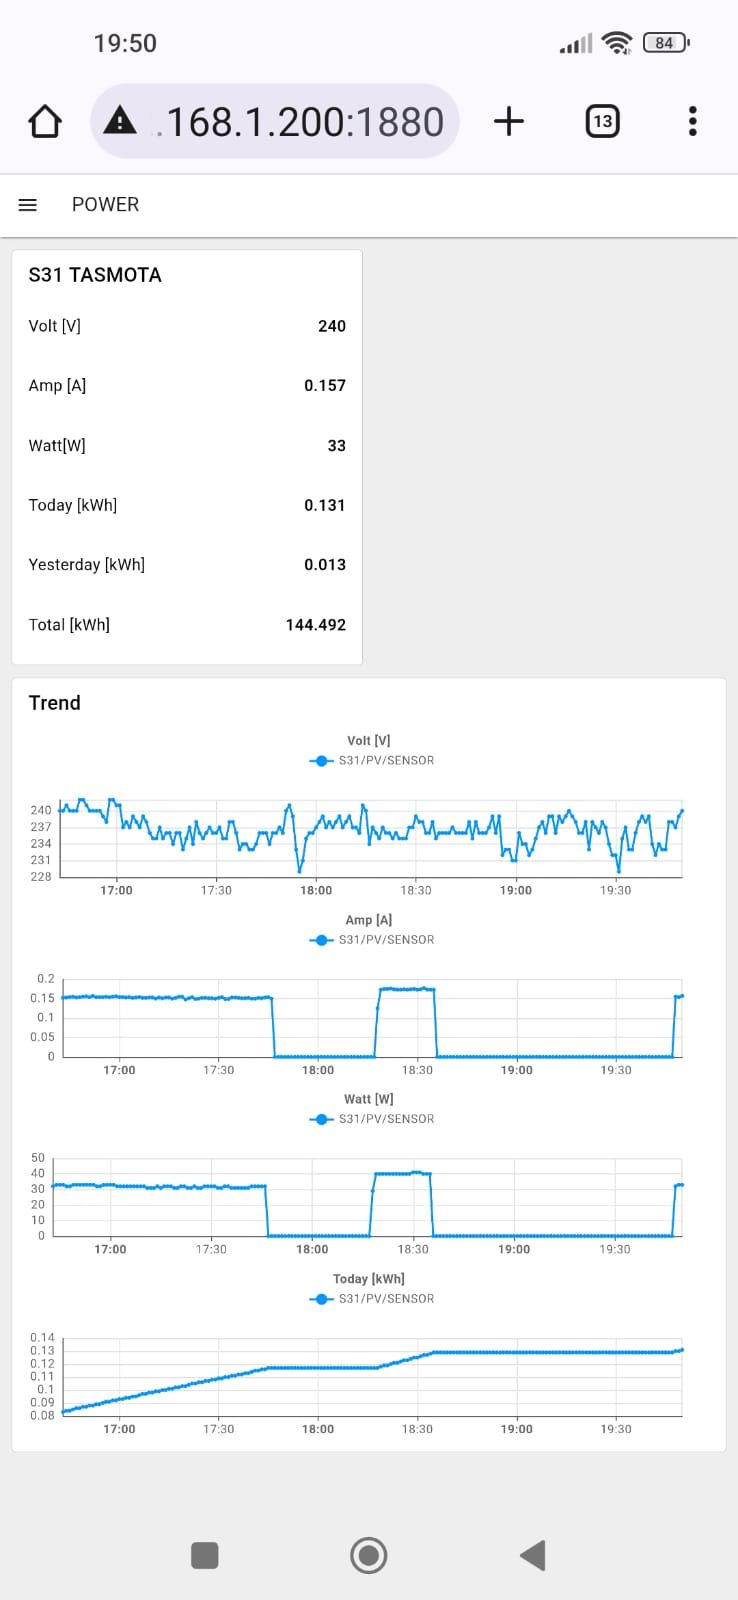
Dashboard 2 as panel and 'current trend'
no data collection ( the meter has a TOTAL ) or operation up to now
( here for test just run a FAN [2] 30W, [3] 40W, OFF for show clean low-range )
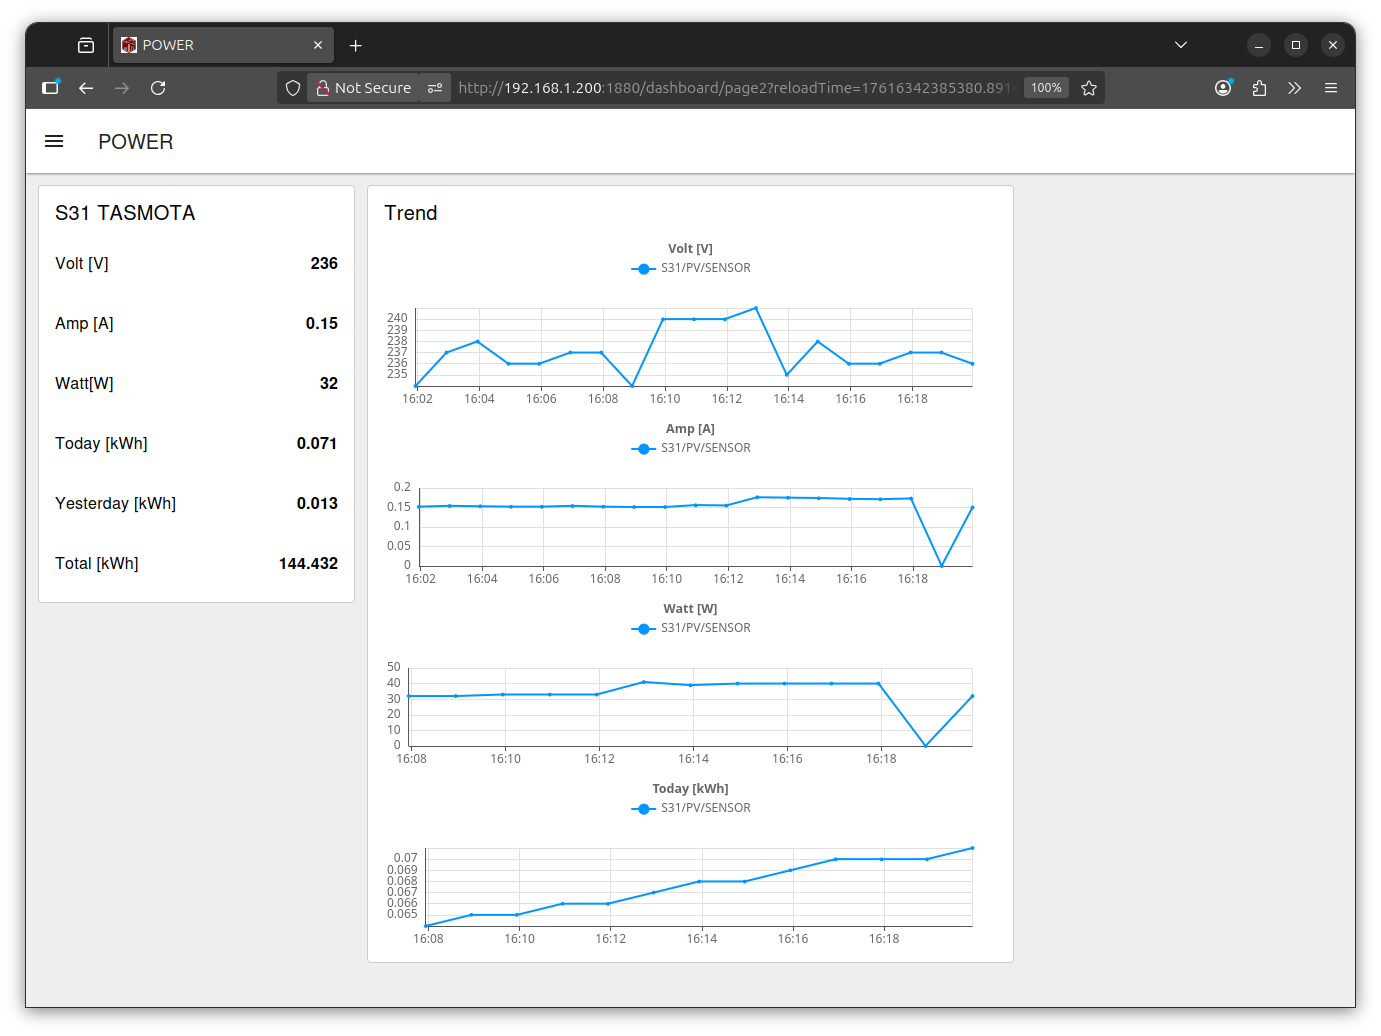
* the meter
* the RPI3
* the dash page viewer ( smart TV / PC / phone )
could be installed each in wifi range from router.

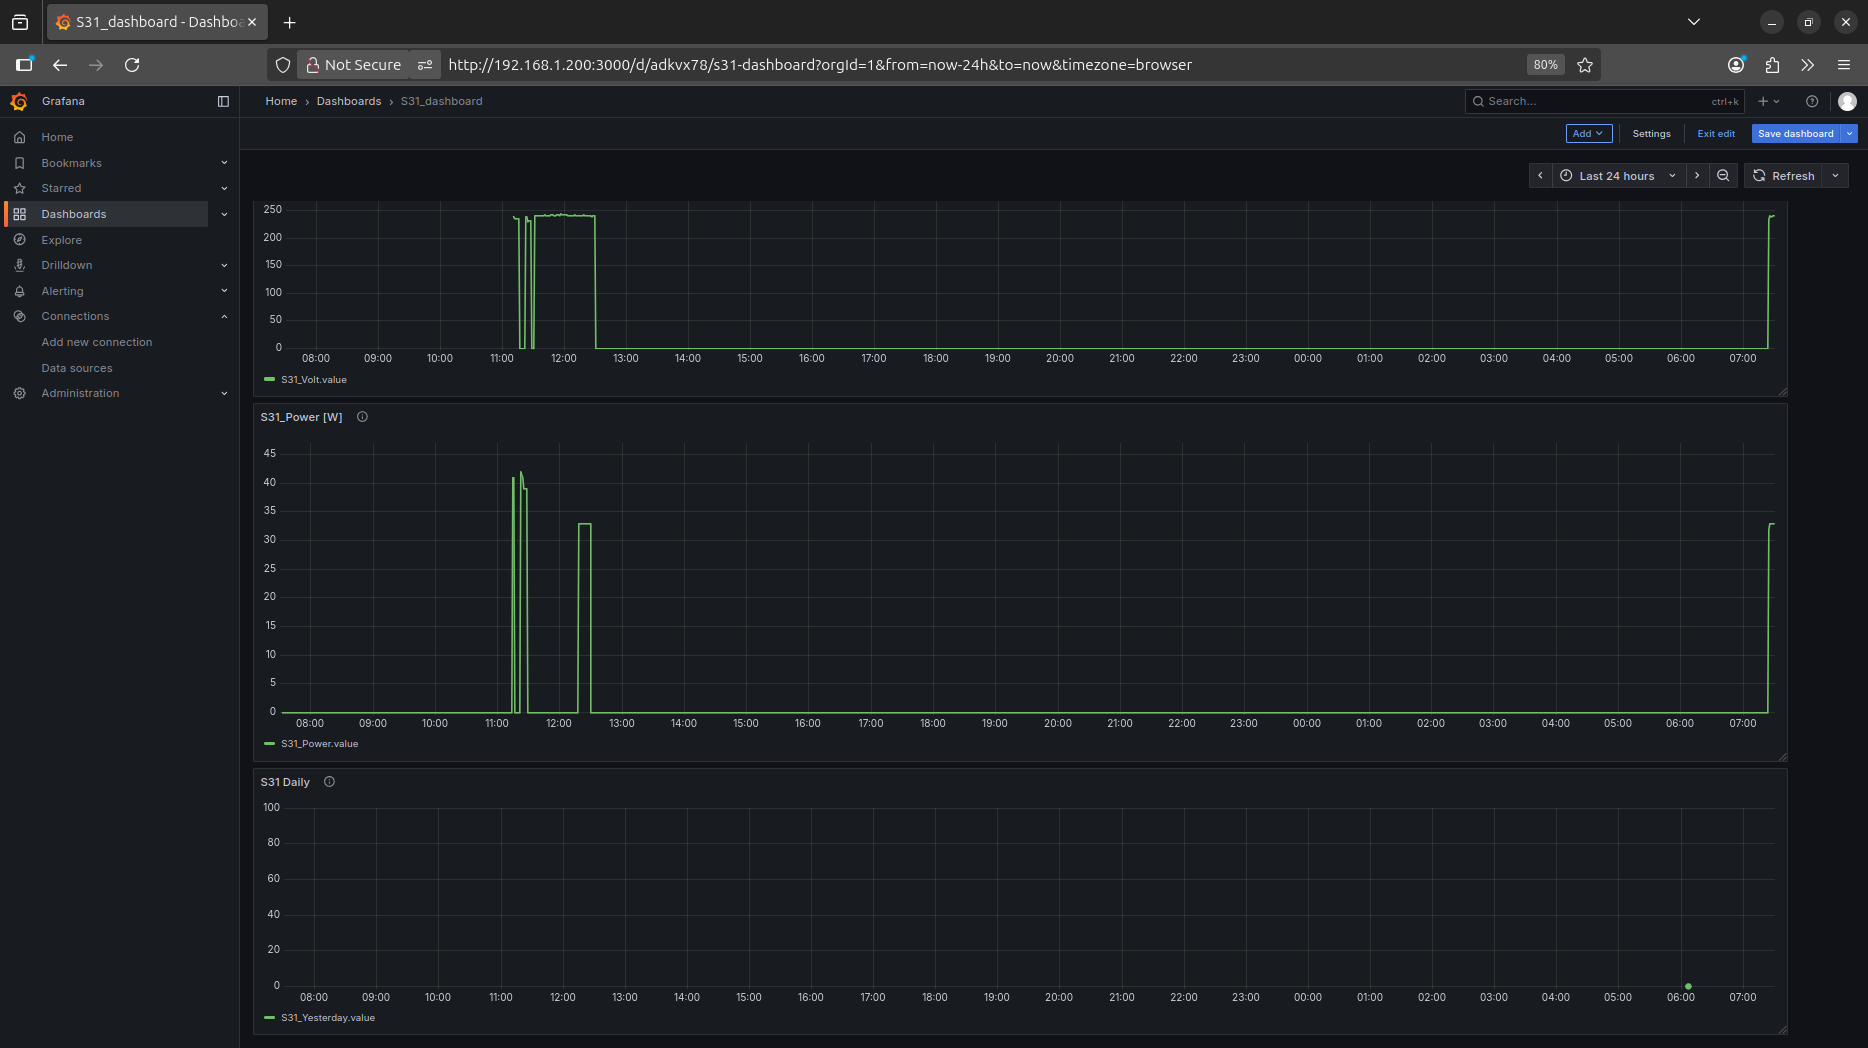
even on phone it looks good ( here big zoom out for snapshot ):
the S31 resets day_counters 6:00 my time (Thailand)??
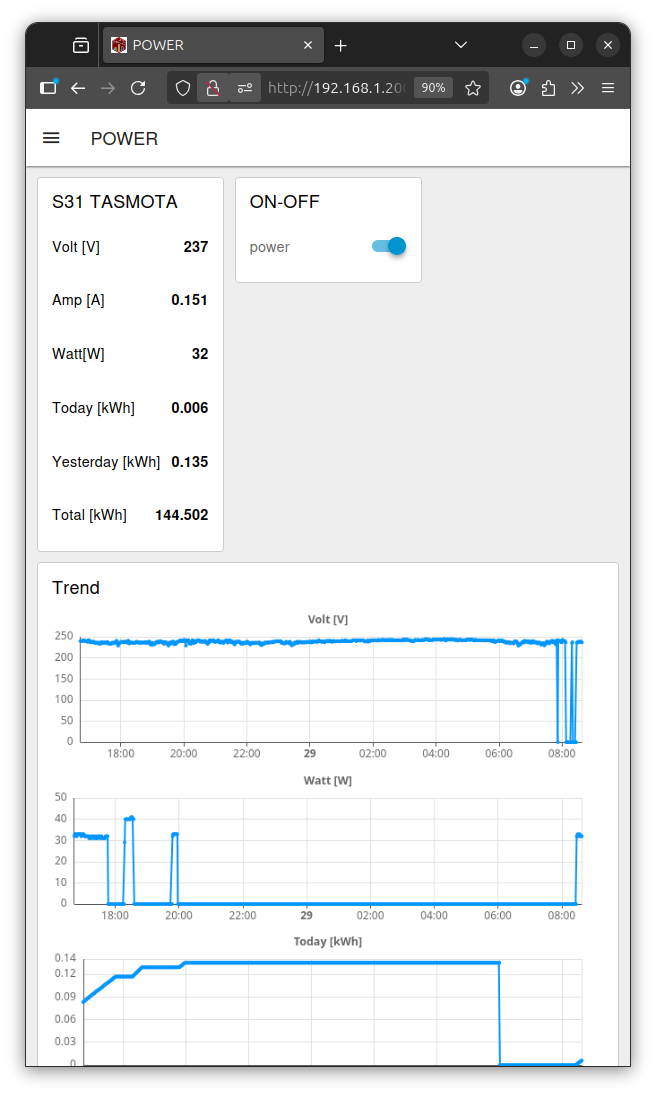
now a small upgrade,
add a power switch ( remote operation ) S31 in the dashboard
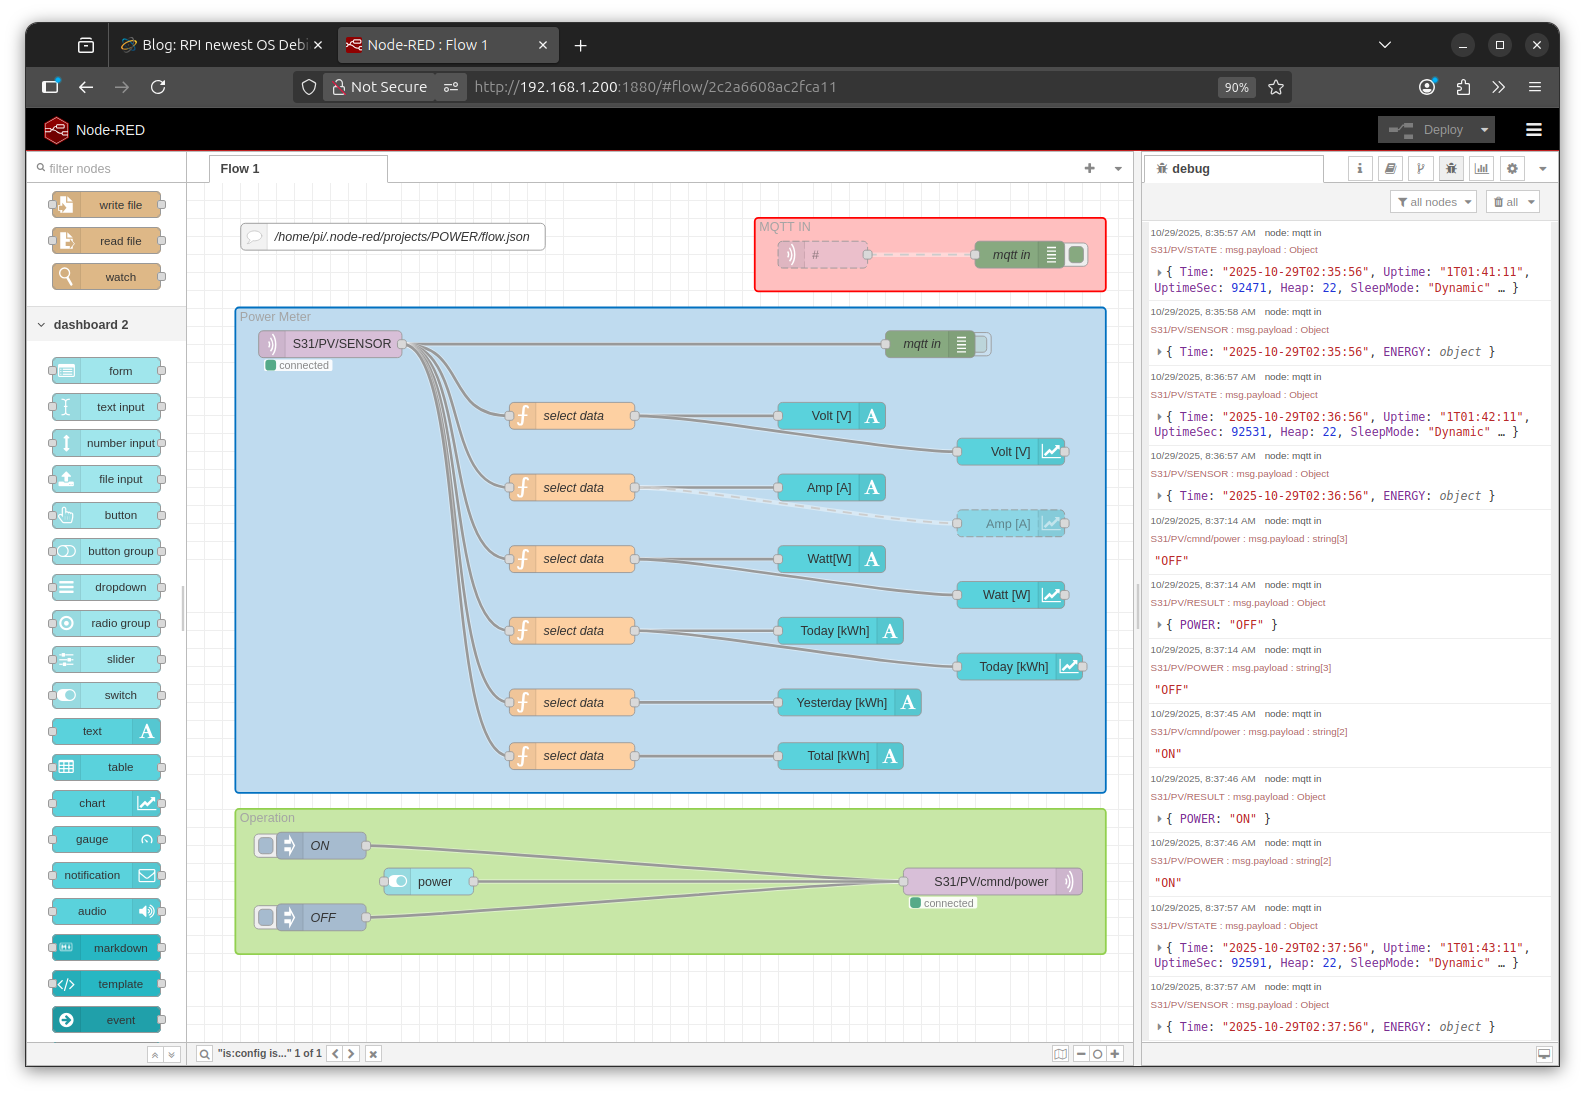
the mqtt command tricky:
TOPIC: "S31/PV/cmnd/power"
PAYLOAD: "ON" or "OFF"
it's all in the flow:
/home/pi/.node-red/projects/POWER/flow.json
now i first try a
SD card copy to uSD as backup
up to now we have Mosquitto and Node-Red installed
and can get MQTT data from the Sonoff - S31 - Tasmota
in my old installations i would use Node Red with SQLite node
and do lots of config to save and retrieve data
for HISTORIC TREND ( inside Node-Red )
but knowing that today a external database:
INFLUXDB
and a external tool for presenting data
GRAFANA
is used:
so now i try THAT via DOCKER:
IOTstack
curl -fsSL https://raw.githubusercontent.com/SensorsIot/IOTstack/master/install.sh | bash
that installs DOCKER
auto reboot
cd IOTstack/
./menu.sh
++ select
+ Grafana
+ InfluxDB
- Mosquitto
- Node-RED
+ Portainer-CE
now all that preparation actually results in ONE file used to setup the containers
docker-compose.yml
could just use that and
docker compose up -d
PORTAINER
https://192.168.1.200:9443
user: admin
new password 12char long
if expired already:
sudo docker stop portainer-ce
sudo docker start portainer-ce
Node-Red to INFLUXDB
volumes:
/home/pi/IOTstack/volumes/influxdb/data /var/lib/influxdb
/home/pi/IOTstack/backups/influxdb/db /var/lib/influxdb/backup
pi@rpi3power:~ $
docker exec -it influxdb influx
Connected to http://localhost:8086 version v1.11.8
InfluxDB shell version: v1.11.8
>
CREATE DATABASE data
>
quit
pi@rpi3power:~ $
( but i not see in /home/pi/IOTstack/volumes/influxdb/data )
___________
for test i try a remote
http://192.168.1.200:8086/
but get
404 page not found
___________
also i check into the
docker-compose.yml
that made it:
 influxdb:
 container_name: influxdb
 image: "influxdb:1.11"
 restart: unless-stopped
 user: "0"
 ports:
 - "8086:8086"
 environment:
 - TZ=Etc/UTC
 - INFLUXDB_HTTP_FLUX_ENABLED=false
 - INFLUXDB_REPORTING_DISABLED=false
 - INFLUXDB_HTTP_AUTH_ENABLED=false
 - INFLUXDB_MONITOR_STORE_ENABLED=FALSE
 # - INFLUX_USERNAME=dba
 # - INFLUX_PASSWORD=supremo
 # - INFLUXDB_UDP_ENABLED=false
 # - INFLUXDB_UDP_BIND_ADDRESS=0.0.0.0:8086
 # - INFLUXDB_UDP_DATABASE=udp
 volumes:
 - ./volumes/influxdb/data:/var/lib/influxdb
 - ./backups/influxdb/db:/var/lib/influxdb/backup
 healthcheck:
 test: ["CMD", "curl", "http://localhost:8086"]
 interval: 30s
 timeout: 10s
 retries: 3
 start_period: 30s
but my point is i want talk to my DOCKER INFLUX db from the ( no DOCKER ) installed Node-Red
so better check installation manual
influxdb/v1
and the
CLI manual
__________
so i try to make a user from CLI
docker exec -it influxdb influx
>
CREATE USER "uPICOW" WITH PASSWORD 'pPICOW' WITH ALL PRIVILEGES
__________
to use it from
Node-Red: / manage palette / install /
node-red-contrib-influxdb
Node-RED nodes to save and query data from an influxdb time series database
0.7.0
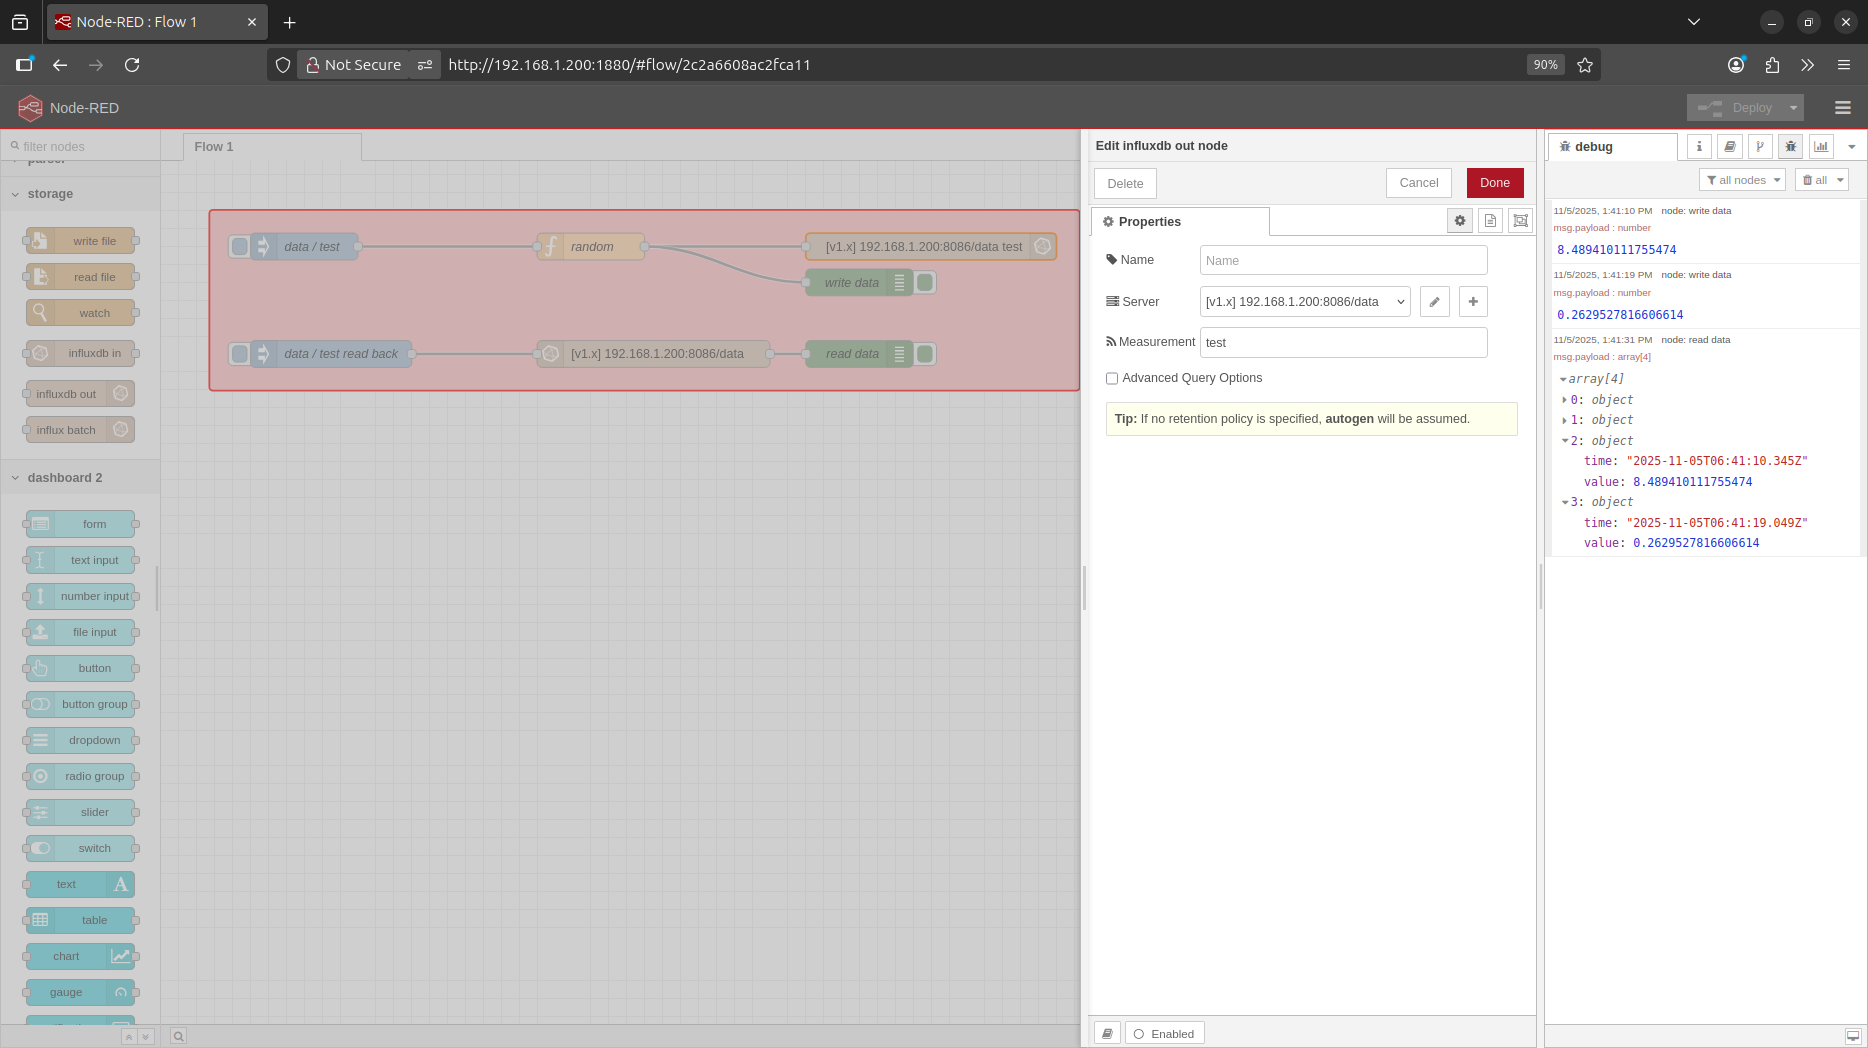
now make a
[out node] and send a number to measurement 'test'
( influx makes automatically the timestamp )
and a
[in node] with a SQL query
SELECT * FROM test
now send the S31 Power measurement to influx database
INFLUXDB to GRAFANA
now try to show the data from influx database in GRAFANA
i not like but it is setup on port :3000
http://192.168.1.200:3000/
at first need login with admin admin
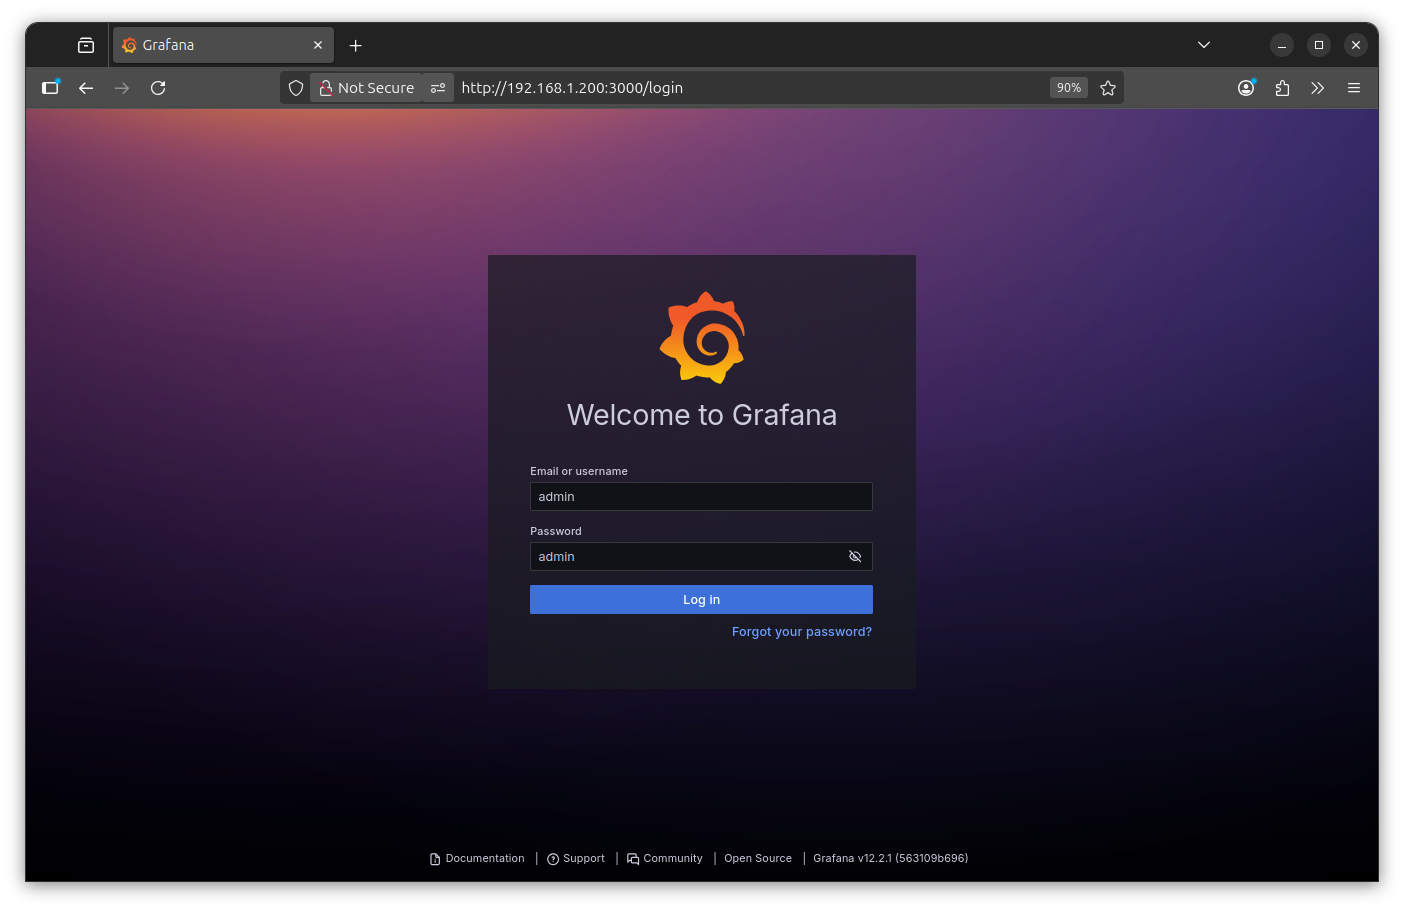
then change password
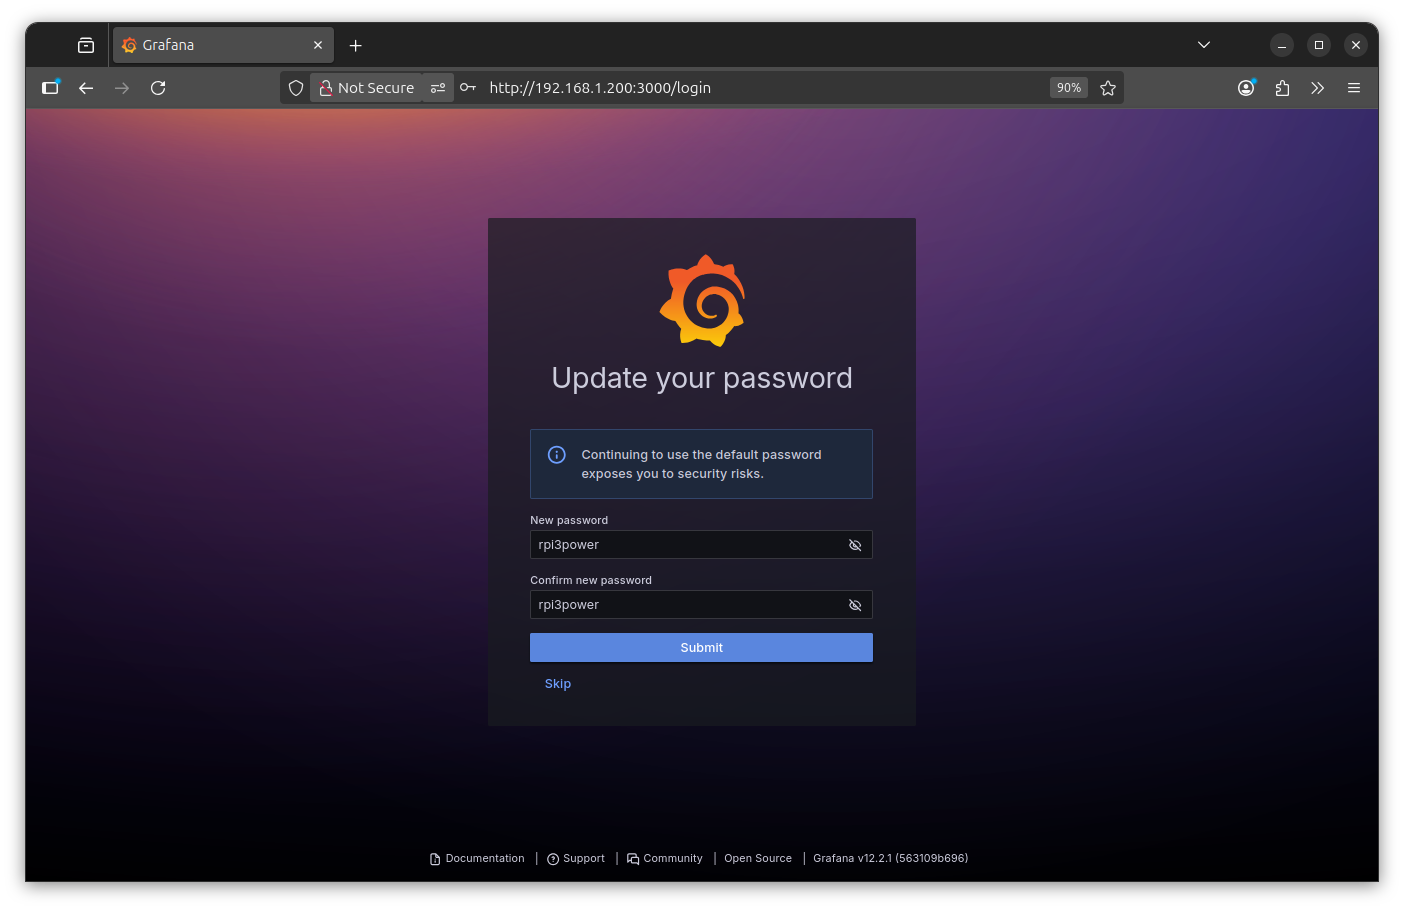
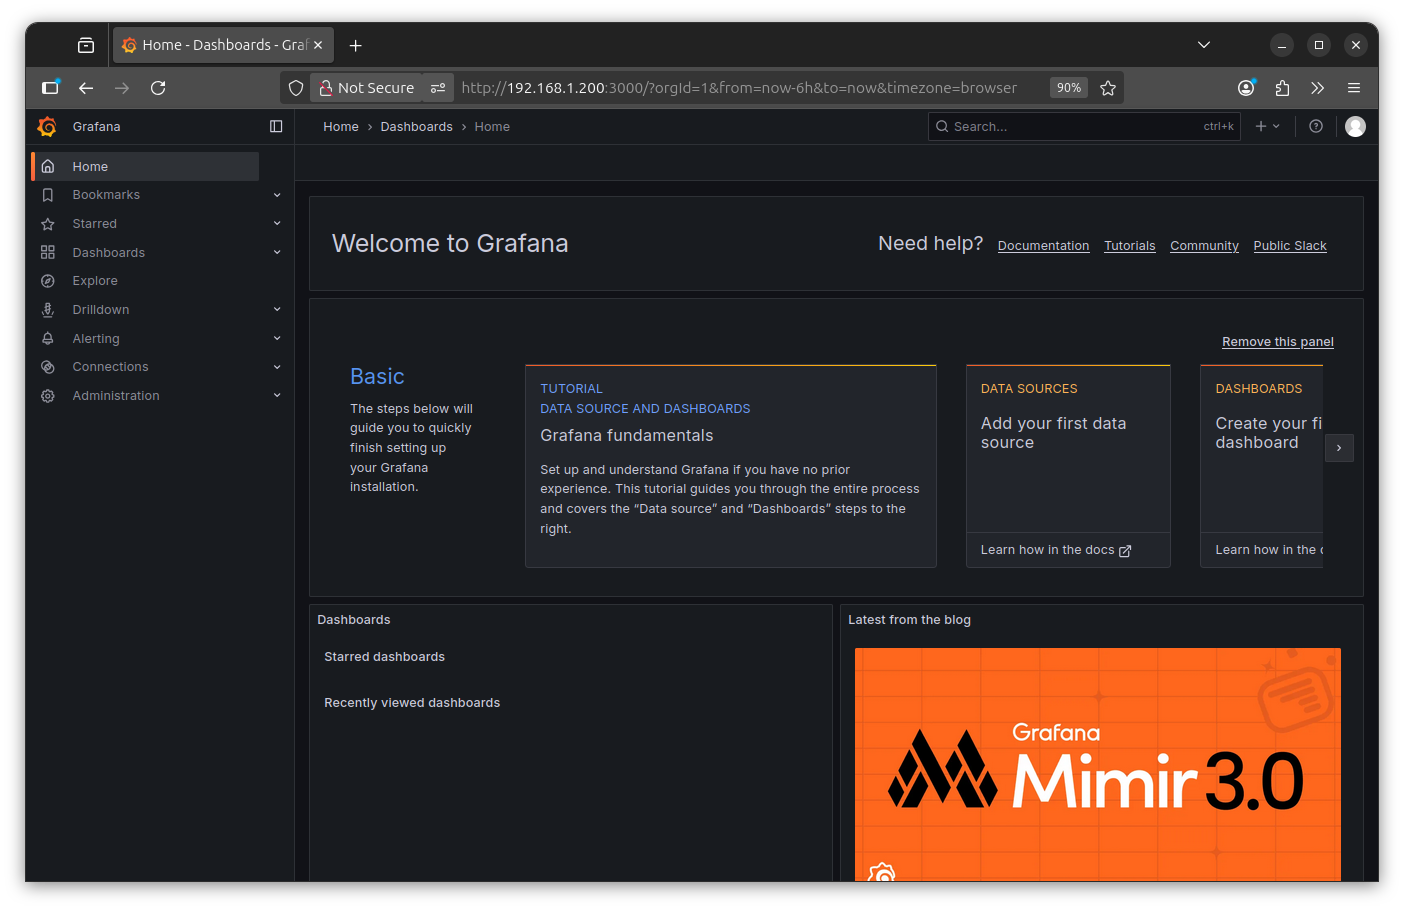
get welcome
connect to INFLUXDB data
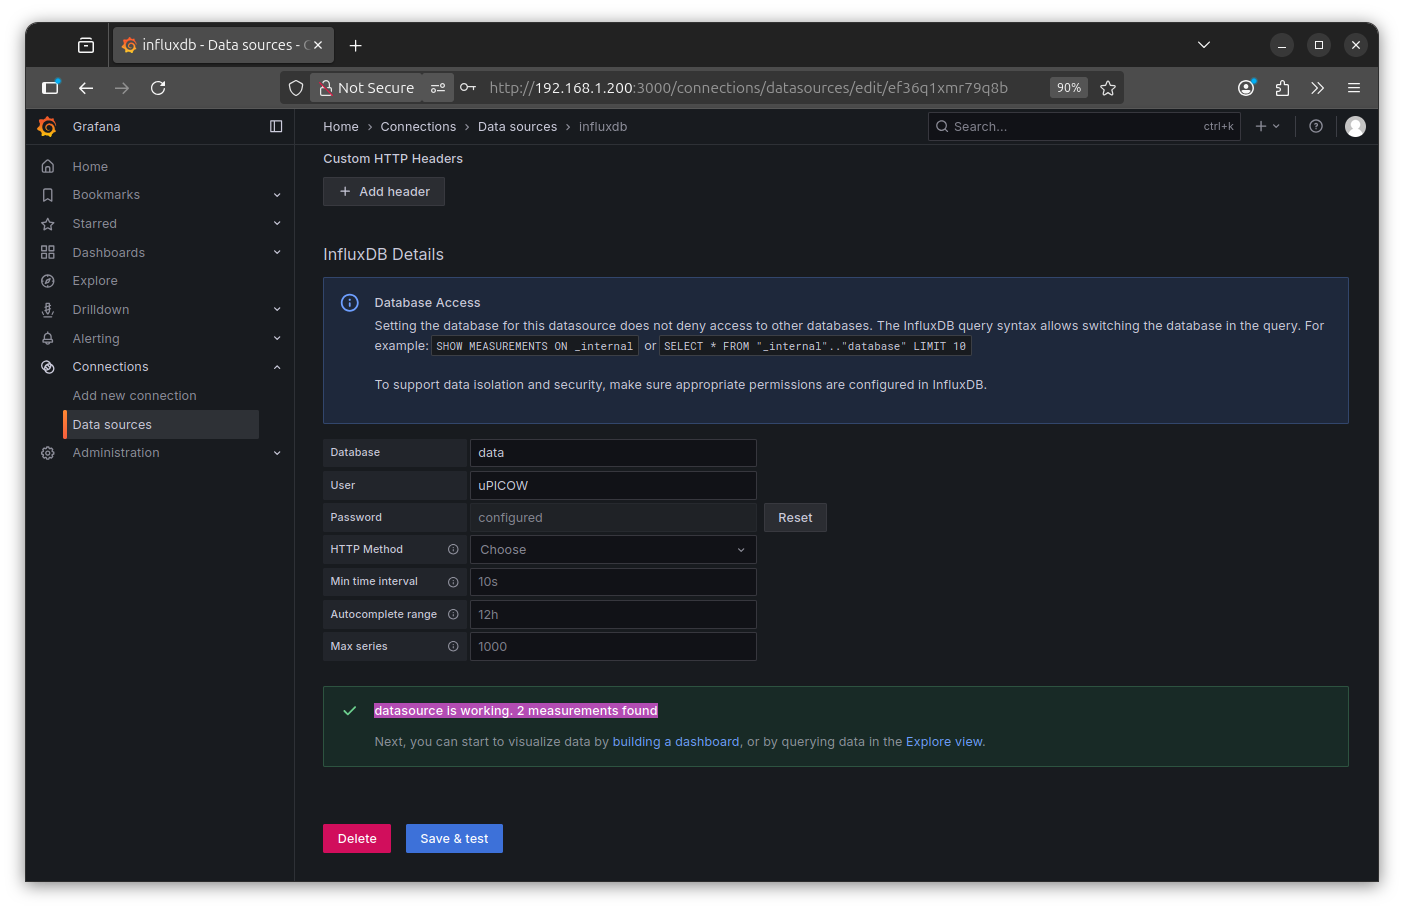
explore data S31_power

dashboard
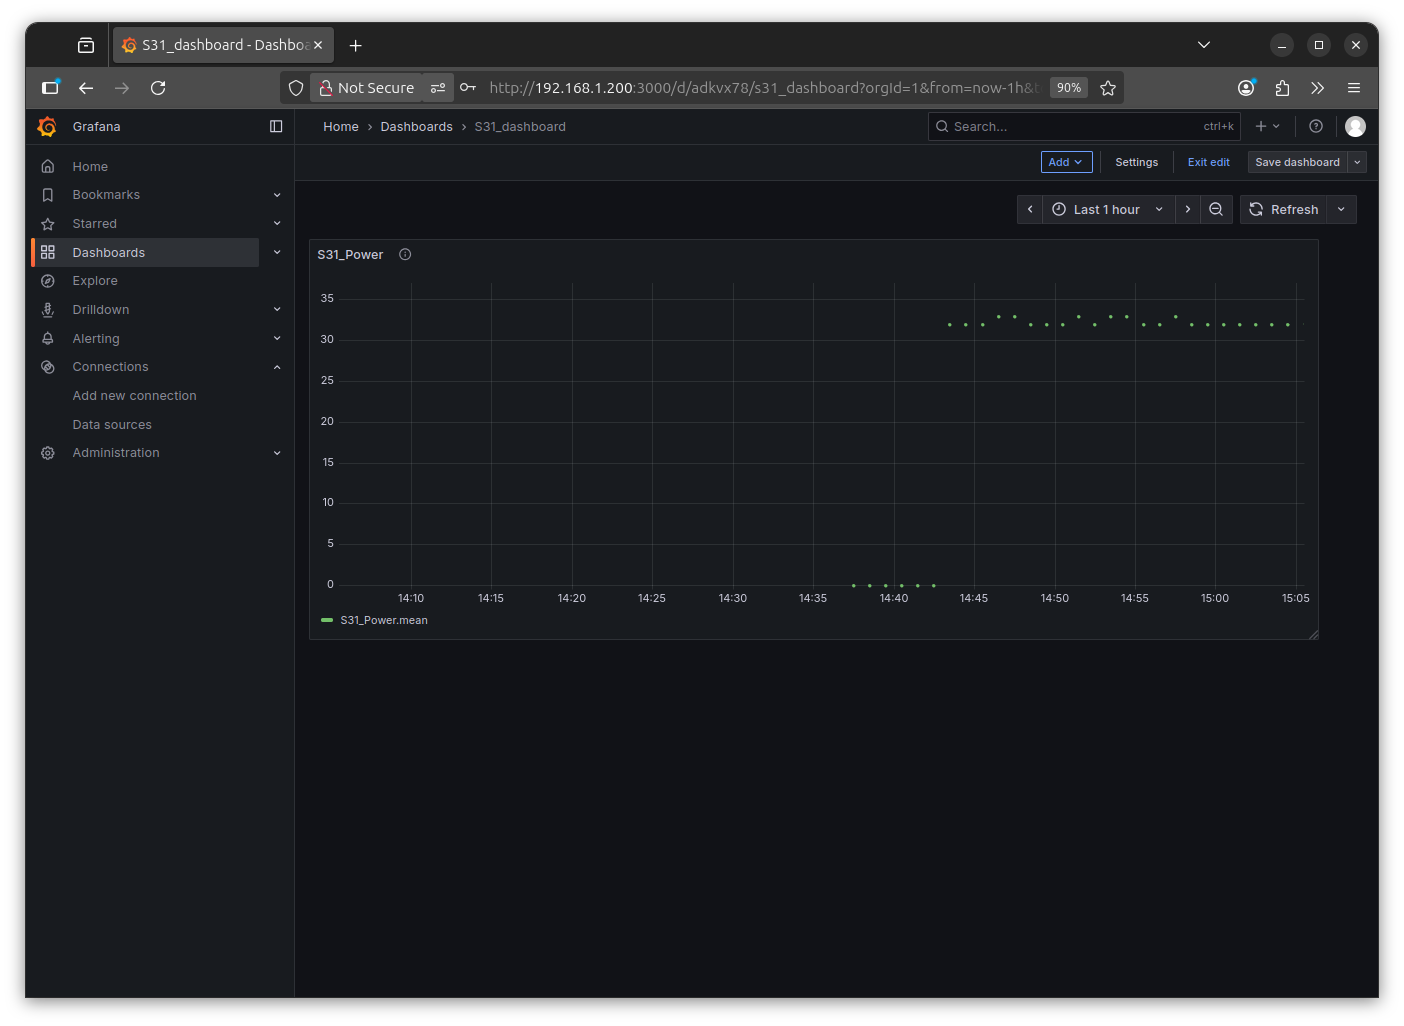 Note: somehow that is not a line with dots, only dots, even grafana is highly configurable i can not change??
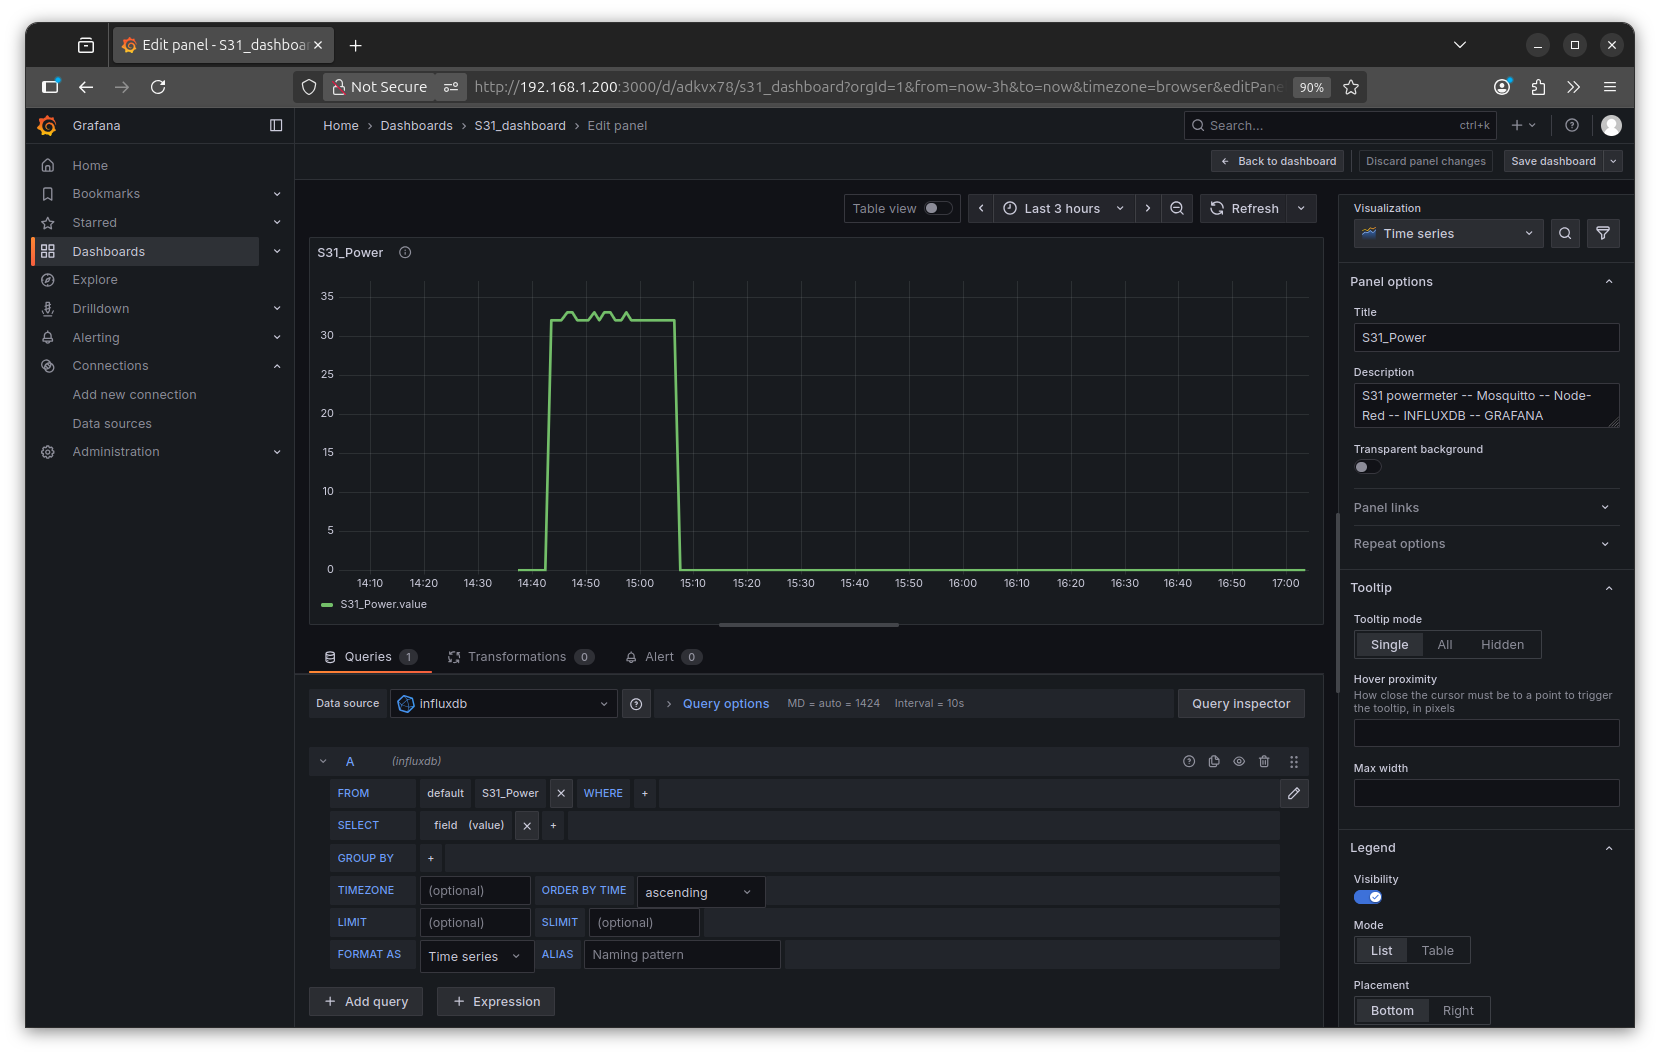
and why it thinks it is a series of 'mean' ?
ok found it: delete from query
- - 'mean'
- - group
to just use the RAW data:
well, try RPI3:
+ Mosquitto
+ Node-Red
+ Docker
+ + INFLUX DB
+ + GRAFANA
was a test and i actually am a little surprised
that it worked so easy.
by the way, today:
HAPPY LOY KRATHONG
here i rework Node-Red and extend the 'historic data collection' :
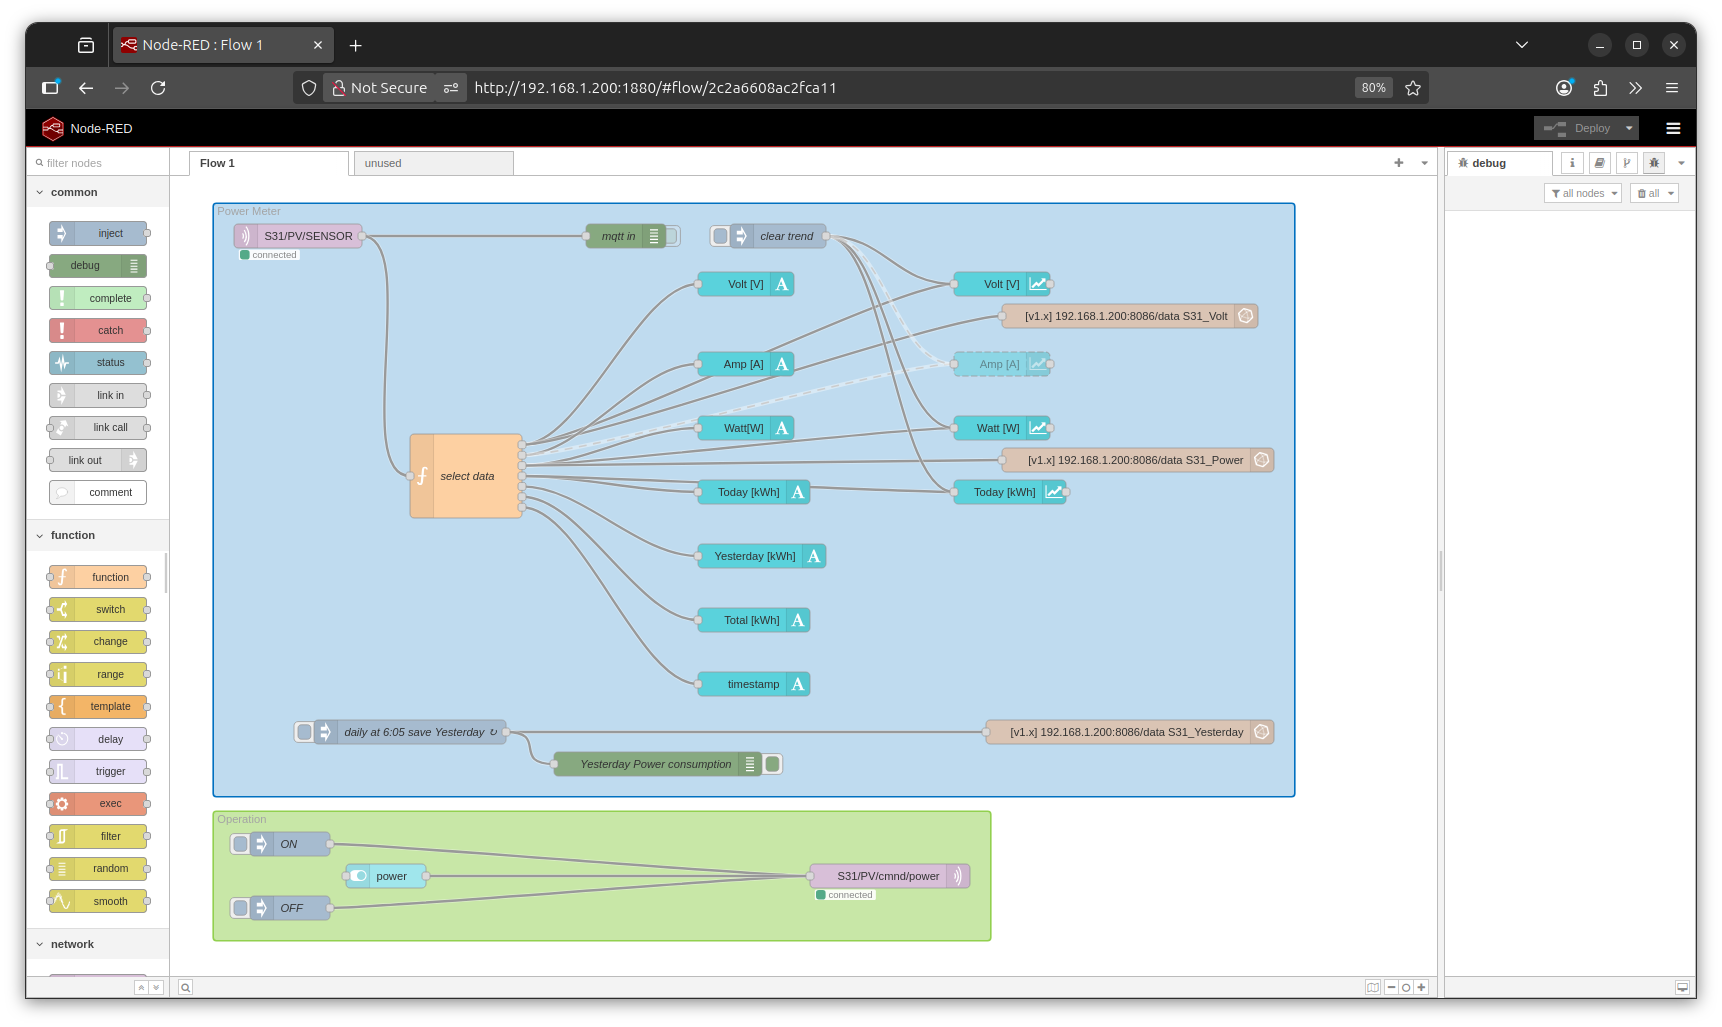
now i store also the Yesterday kWh, but not every minute, only once a day at 6:05 ( at 6:00 Today accumulation is reset )
and hope it will be a nice bar-graph monthly / yearly
try:
NR code
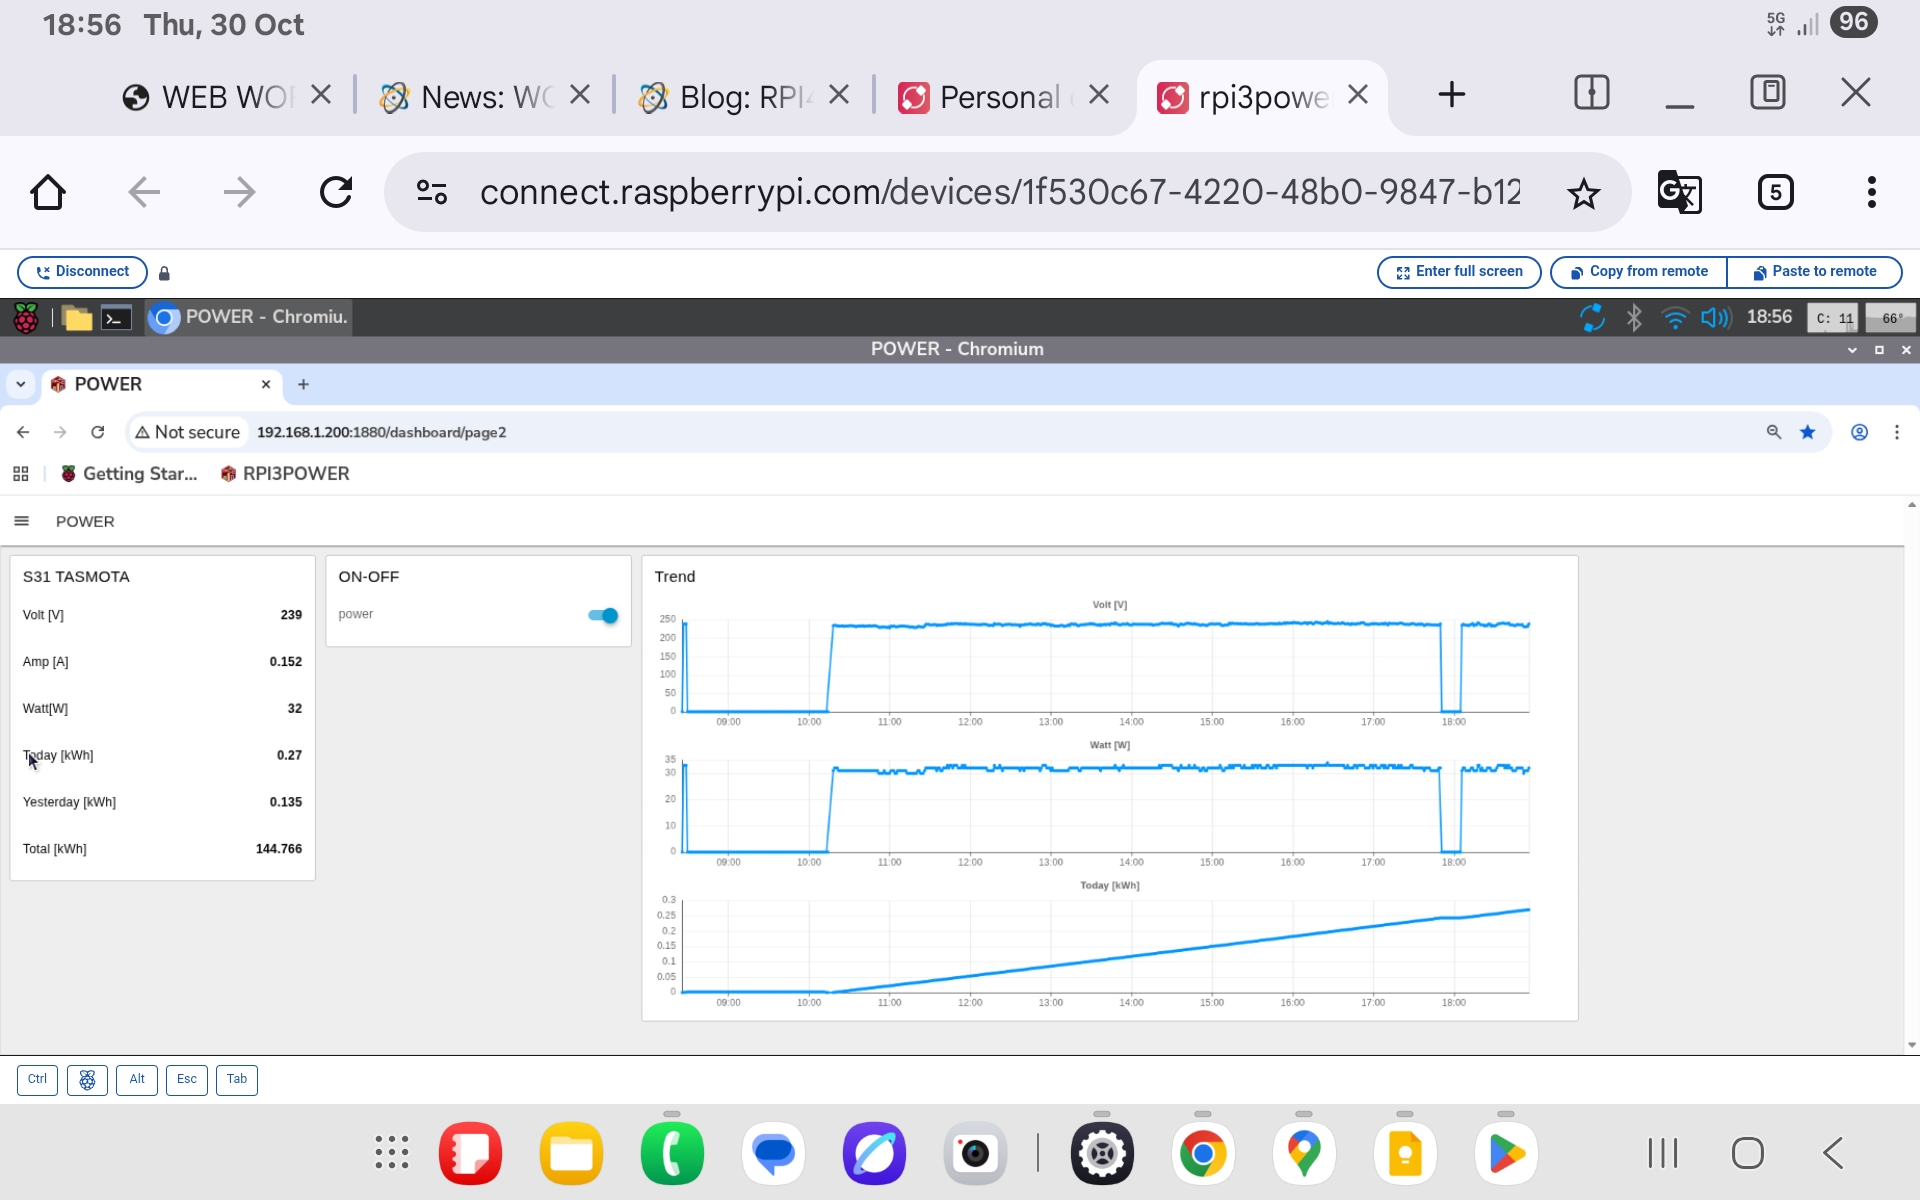
RPI3 online
can i see that online?
well you can think about 'selfhosting' ...
but i just go a more easy way:
raspberrypi.com/software/connect/
so when i bring my RPI online ( by a peer to peer connection / no data via raspberry company )
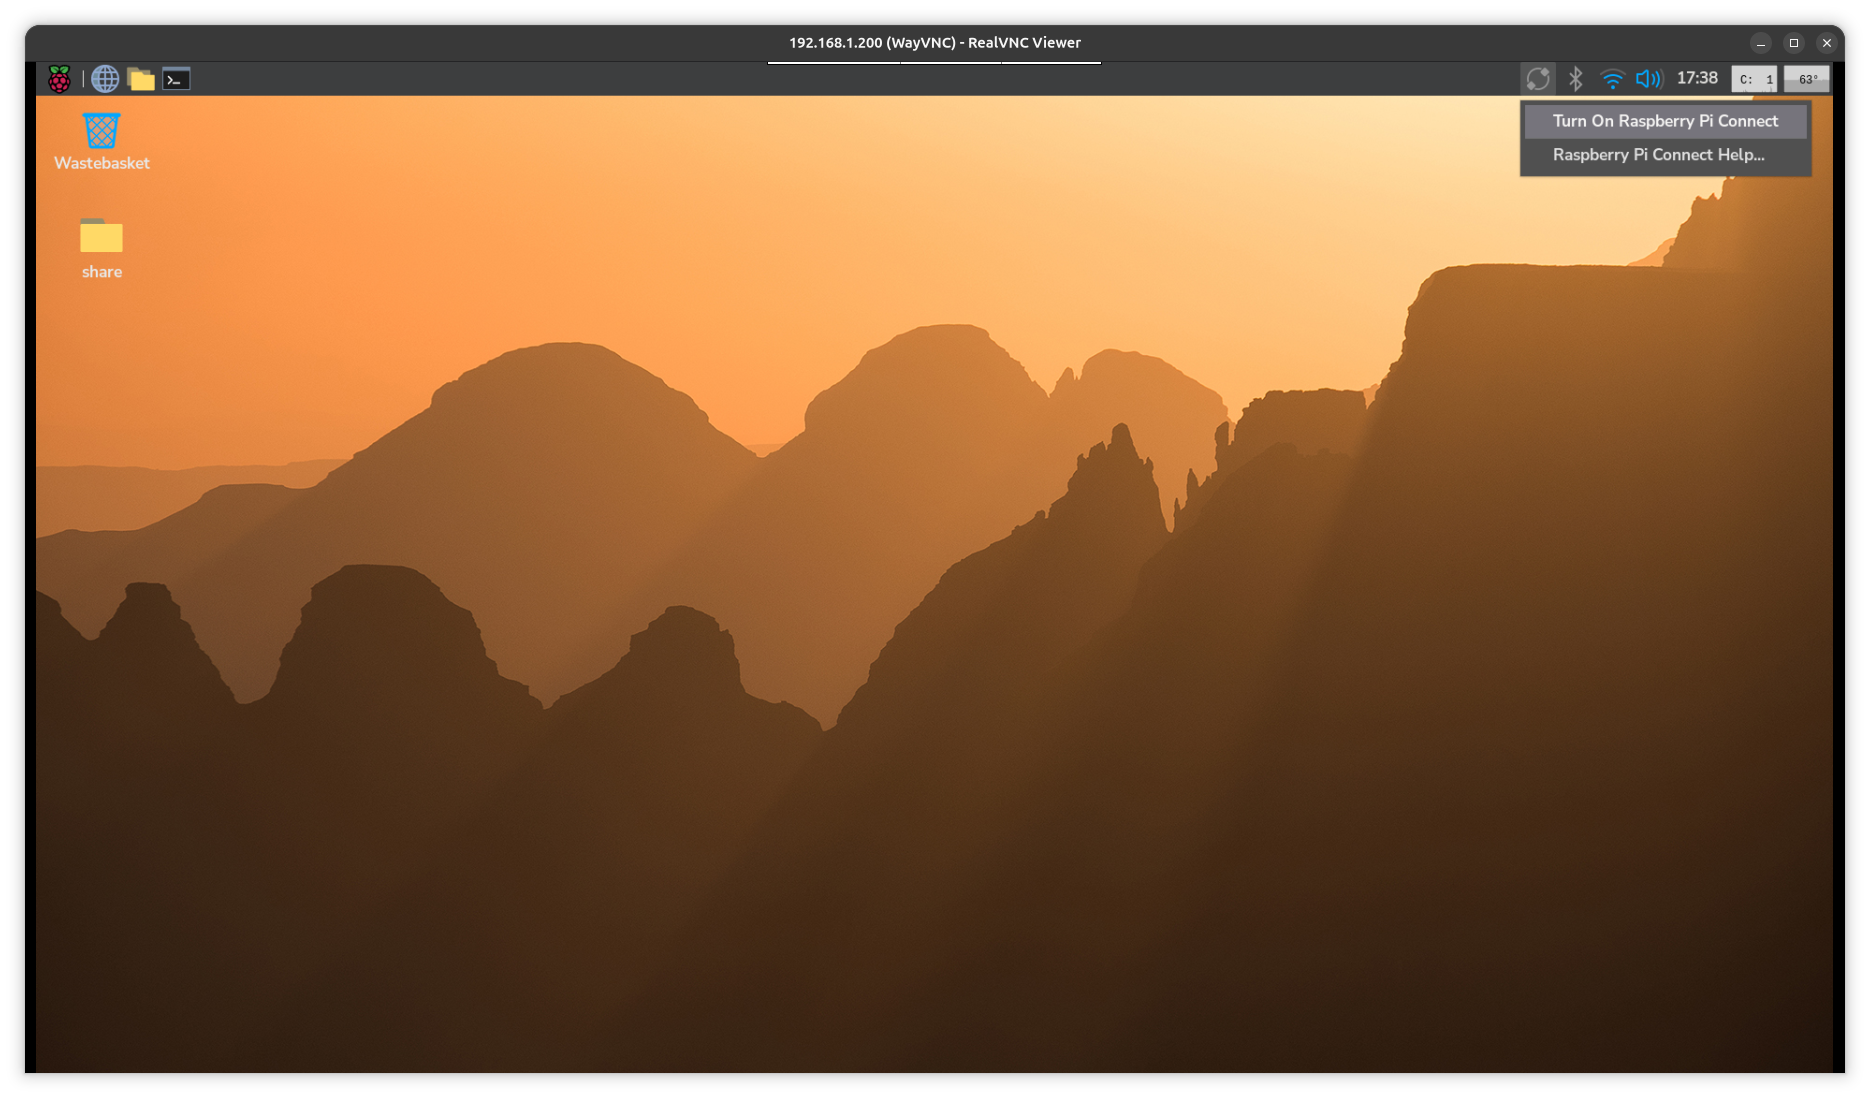
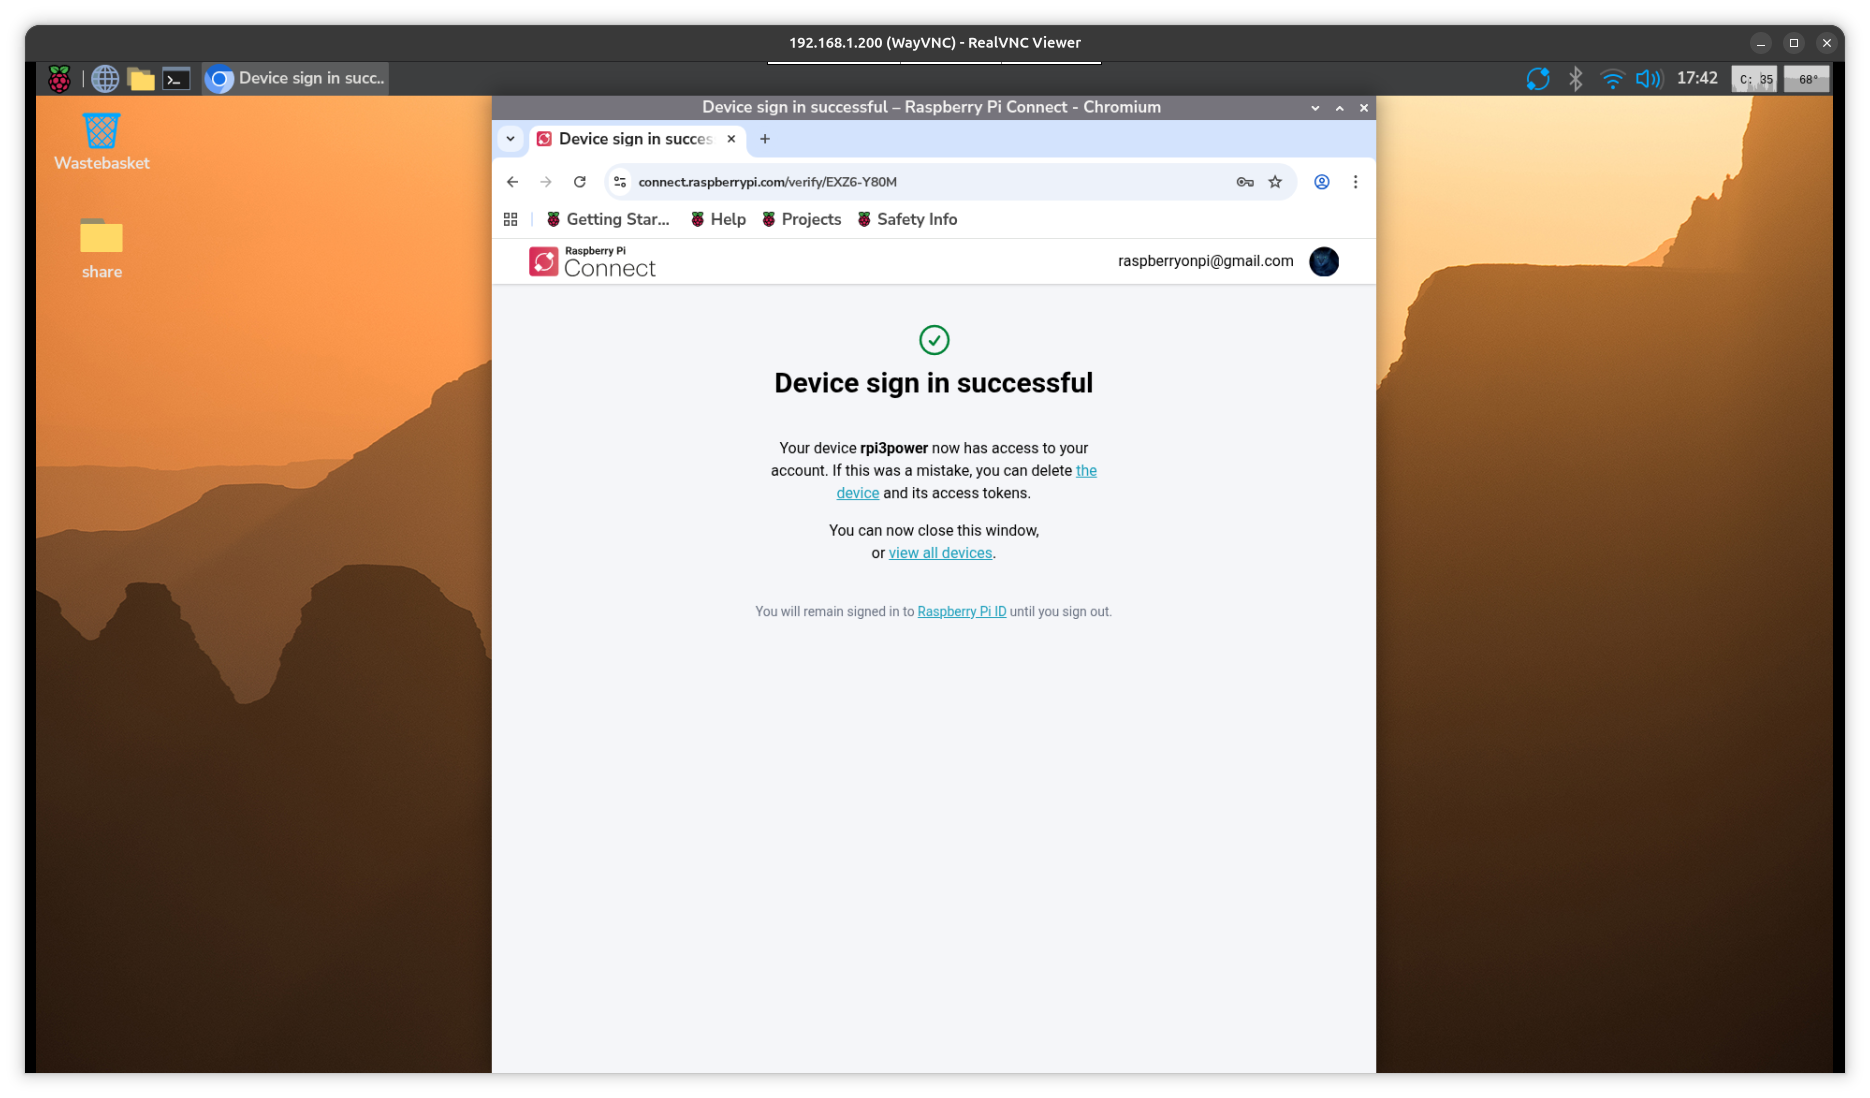
* by making a free account at RPI
* activating the tunnel server in my RPI ( from desktop header menu )
* and from a remote browser login to that account and call up my RPI
you can select:
* * ssh terminal
* * desktop
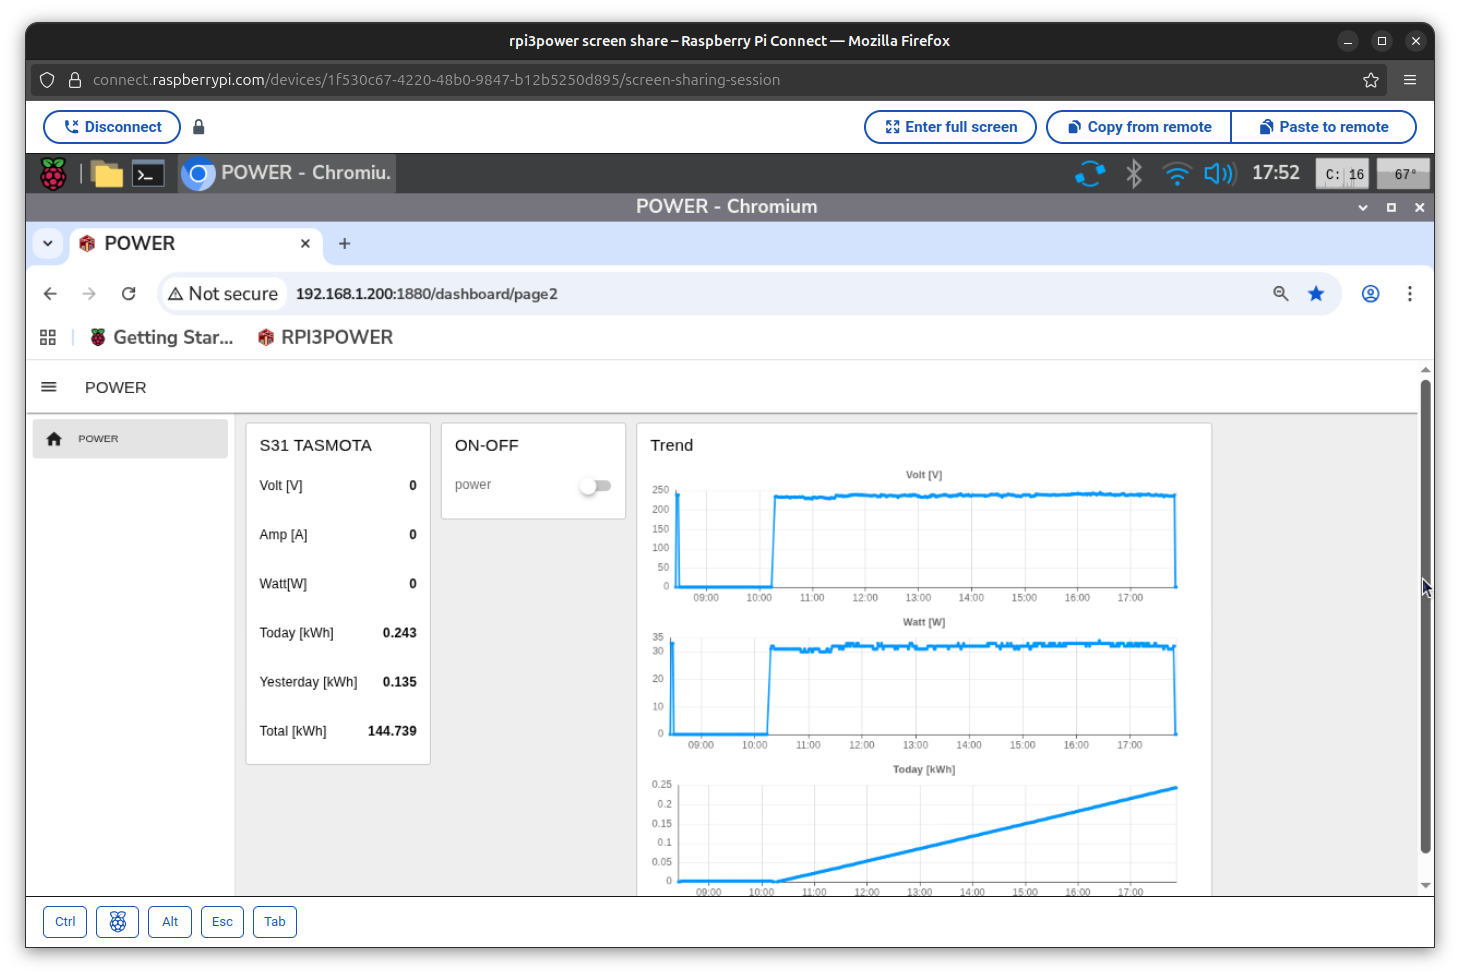
i use desktop and can operate my RPI remotely
also i can start chrome browser ( yes, too slow on a RPI3 )
and there call the local Node-Red Dashboard
http://192.168.1.200:1880/dashboard/
* * * while that is actually only local
* * * and not password protected from my easy setup (if use 'remote operation' it should be password protected )


and test from Samsung Tablet ( running only on data SIM )