processing
i long time not play
* processing
* p5.js
and also stopped there forum work after problems with 'forum moderators' years ago
but now i see
p5.js V2.x is in 'beta'
so i want to revisit it.
p5js.org
and has its own
reference
possibly most known for its use by artists
processing
( as java desktop app or HTML embedded JS canvas )
is special for the graphic capabilities, but also sound and photo tools are strong.
here some links to my earlier work:
processing TUTORIAL
electrical engineering tool
play my HandPan emulation
so first i try p5.js version 2.0.5 in the online editor
and using my MOD from a very old code from Daniel Shiffman
p5v2_recursive_tree
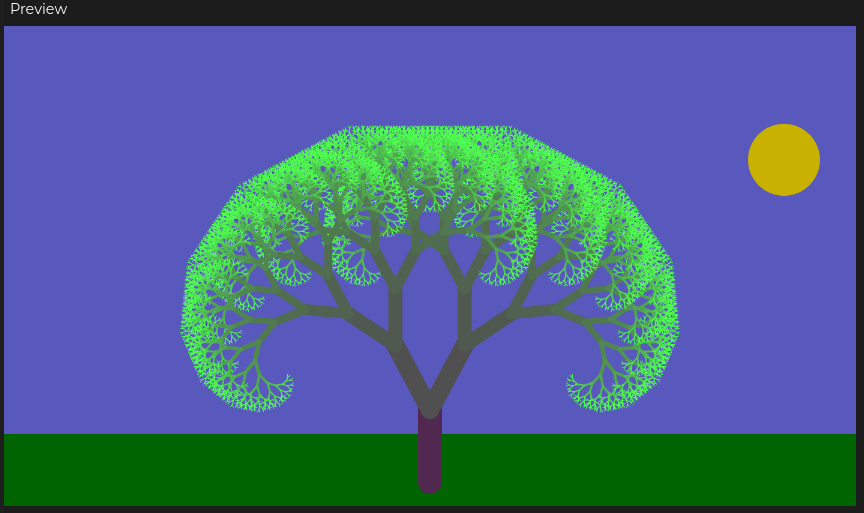
pls . use mouse X and Y for animation
now above electric engineering example already shows that
i want use it not for just make a nice graphic ( a canvas in an empty html )
* i want it interactive ( mouse movement ) and also use parameter input from html input fields
* use the HTML also for better / dynamic page info like the printed electric calculations ( and the optional [help] texts included )
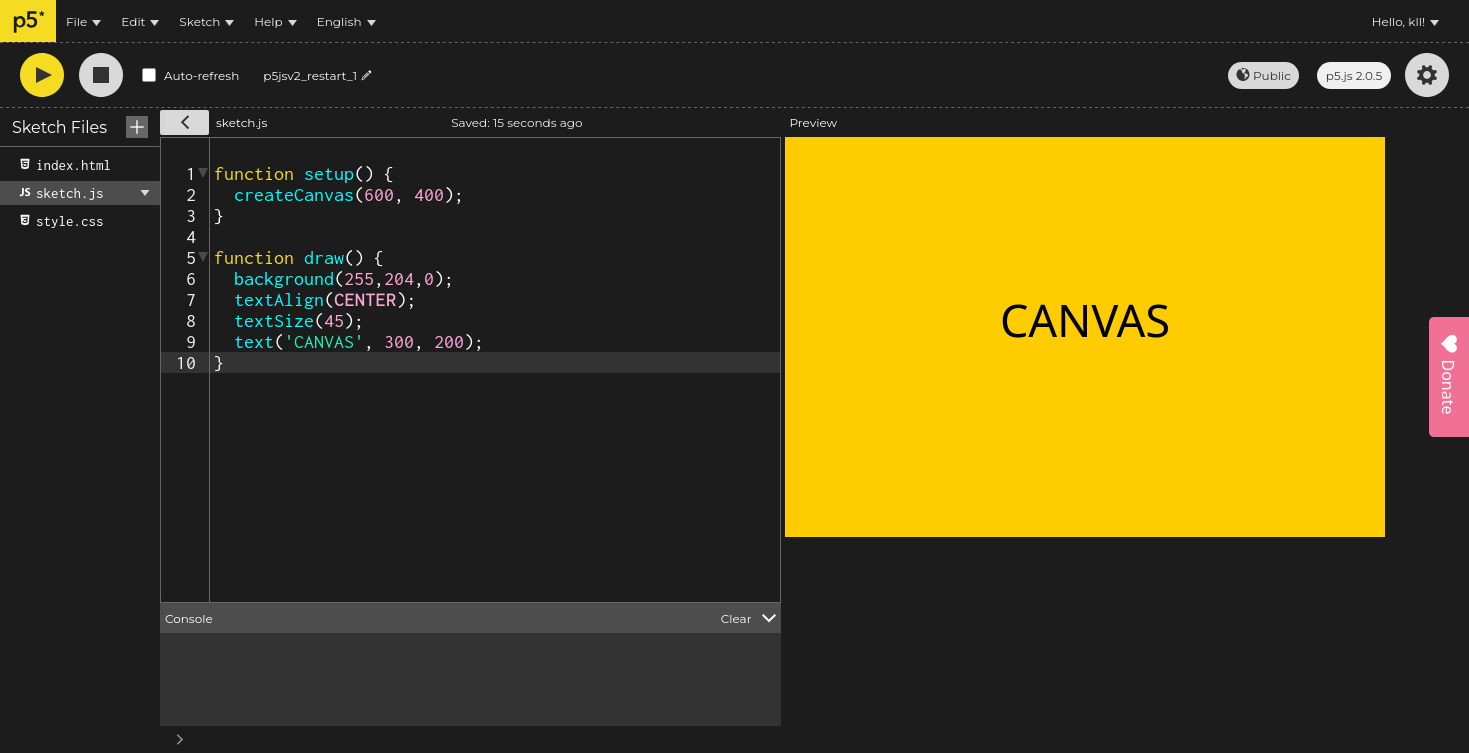
step 1
start a new online p5.js example using version 2.0.5
and add some color and text to the canvas
 code
code
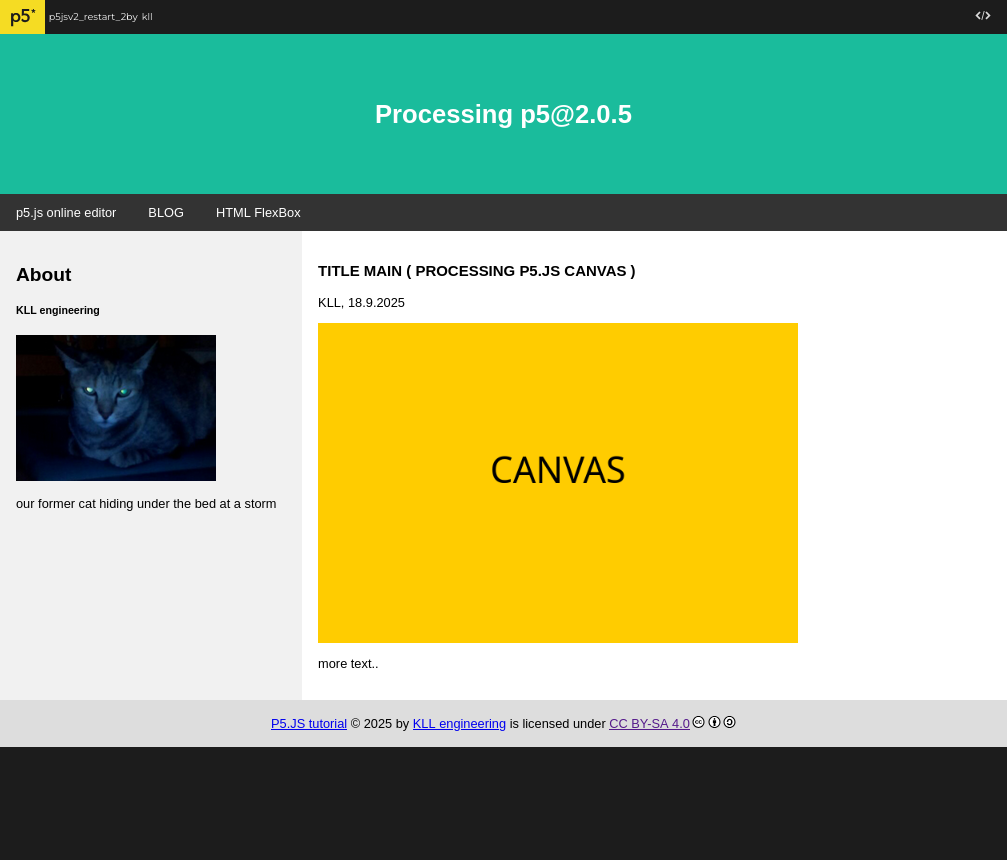
step 2
edit the
index.html using a responsible flex-box design ( i get from
w3schools )
 code
code
filled some HTML template defaults with example data,
but you can easily adapt it.
the main trick was to position the p5.js canvas in the 'main' HTML DIV via a 'id'
short example
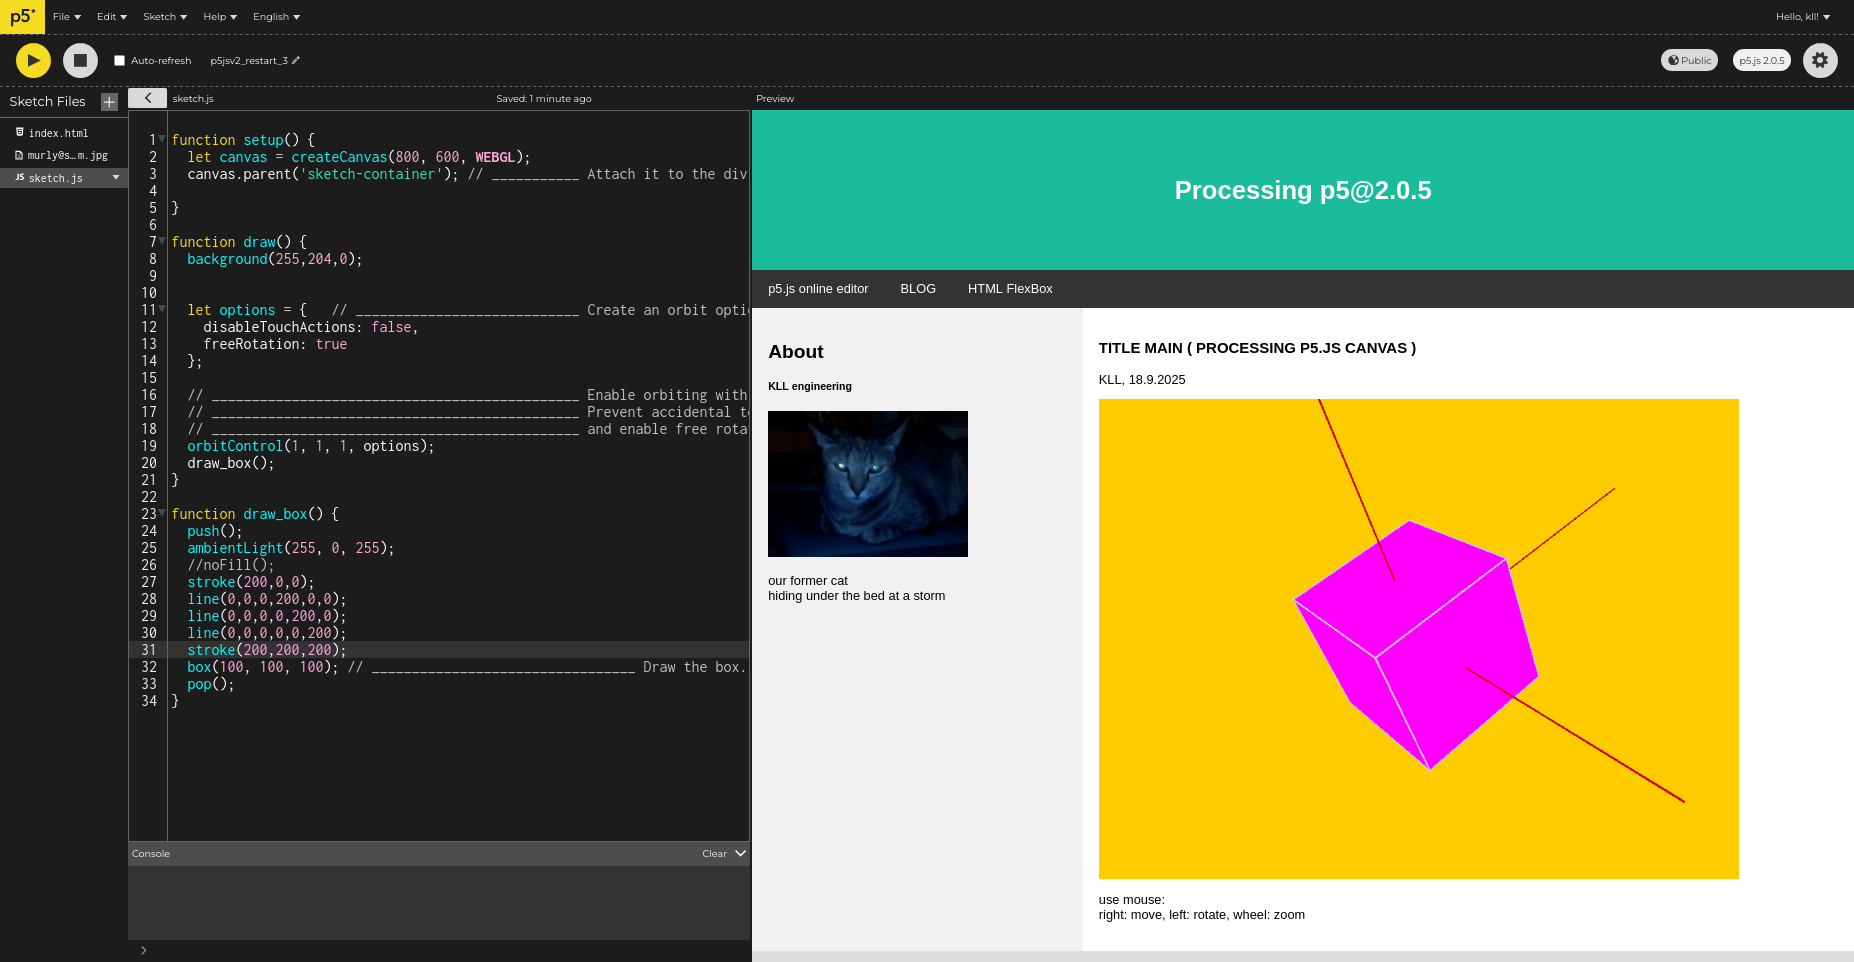
step 3
now work on the p5.js sketch.js
to make a 3D view ( using orbitControl )
 code
code
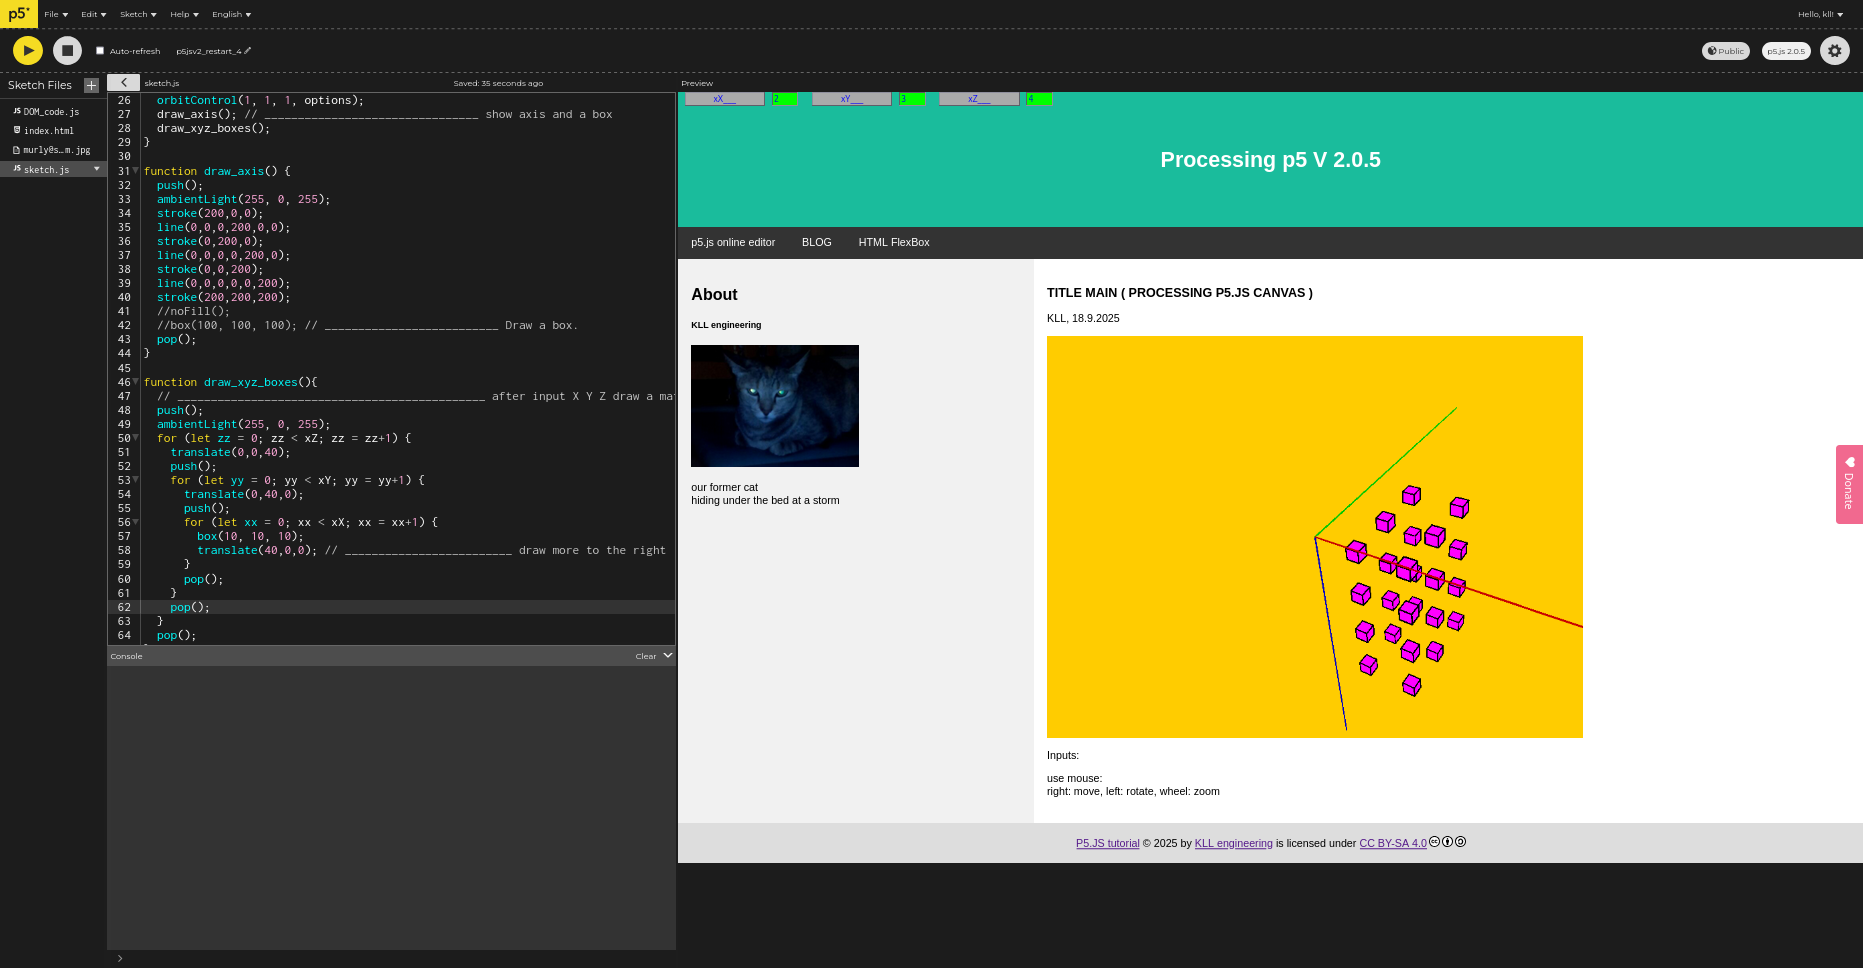
step 4
create 3 input fields for X Y Z values
see DOM_code.js ( incl. update functions on change )
and use that to draw objects.
so here i have still the problem to position the input fields on the right place in the html document...
! i used new style of input fields, created in JS code instead in HTML
// if i can not find a way need to go back to old style
code
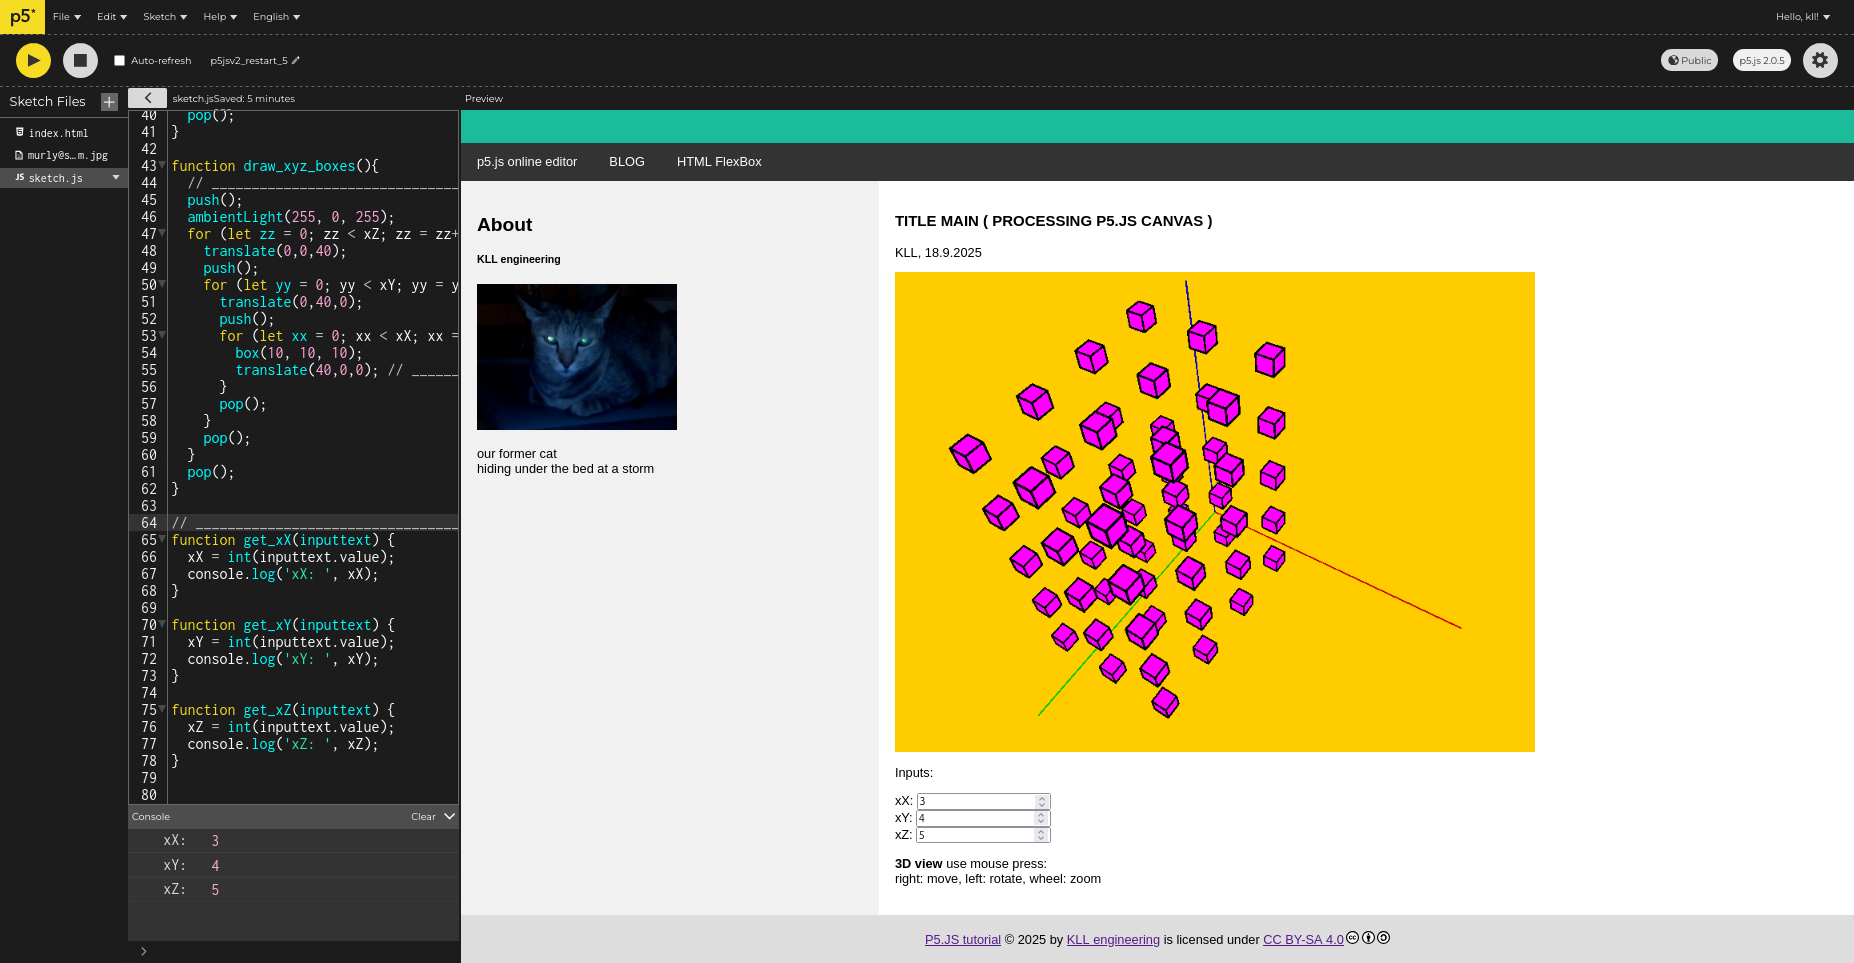
step 5
ok change back (delete ) DOM code to
old style html input fields, now positioned in HTML
and calling a JS function on change ( much more easy as the recent DOM coding )
 code
code
step 6
now as the code is working we can download it ( from the online editor )
and copy it into our html test directory on PC desktop ( double click on file index.html )
or deploy it to the RPI3 nginx web-server
note: it comes as a ZIP including the big p5.js lib but that is actually unused
as it is called by index.html from https://cdn.jsdelivr.net/npm/p5@2.0.5/lib/p5.js anyhow
so that file could be deleted.
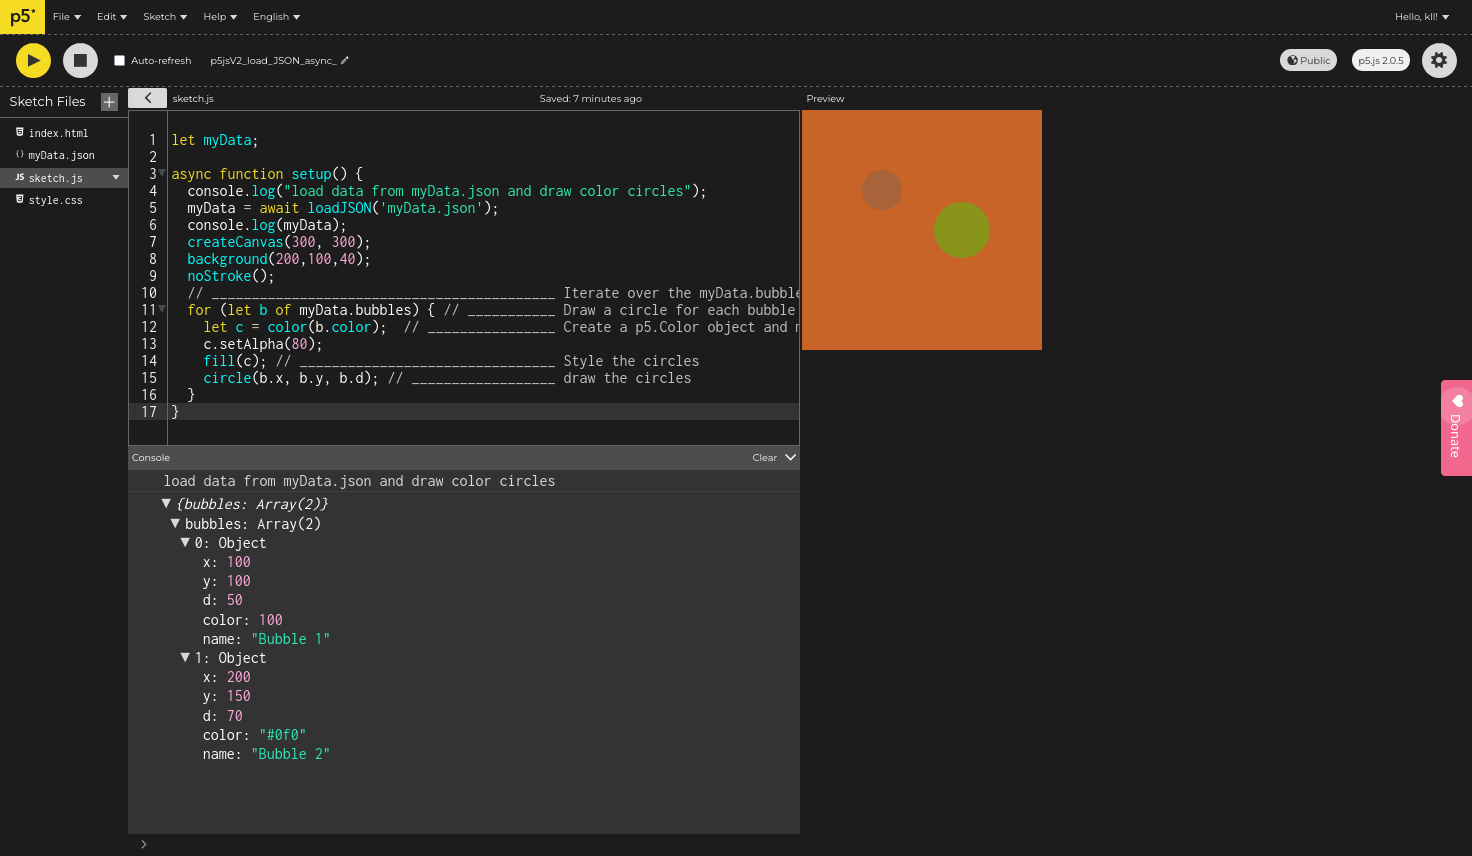
step 7
changes in V2
the file preload function is depricated now use
async await
here a example load data from JSON file
 code
code
step 8
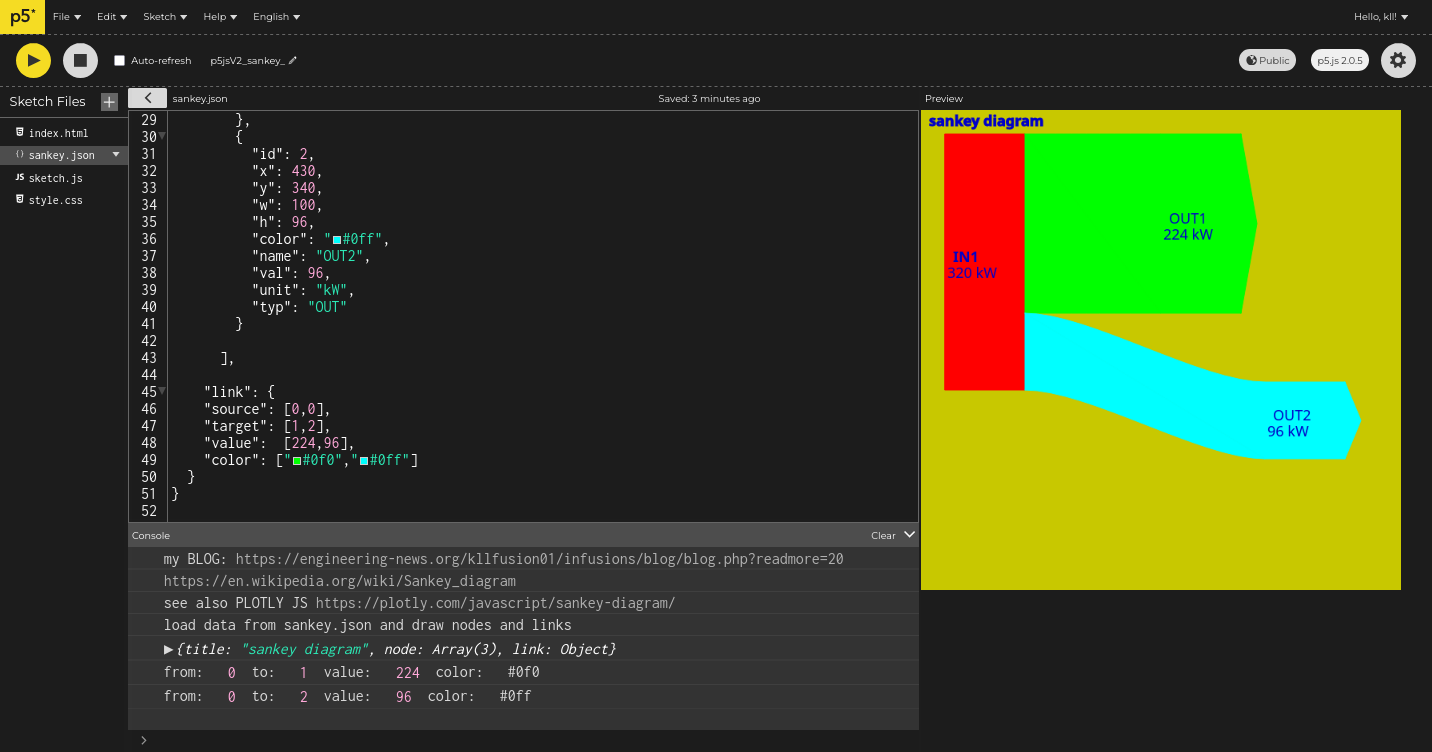
try a 'manual'
sankey diagram
from JSON data
that curved path try by new version of bezierVertex ( function inside beginShape() endShape() )
 code
code
step 9
i started with a combination of
extended HTML page
and a CANVAS with orbitControl ( 3D view mouse operation )
and here focused on a 'index.html' as a static layout, but NO content.
like with 'DIV' but named with like id='FOOTER'
and in p5.js setup write dynamic content to that.
CANVAS
and for draw used a list of SOL planet data as circles and spheres ( on X axis only for now )
that was revision 1.0.2
but now in
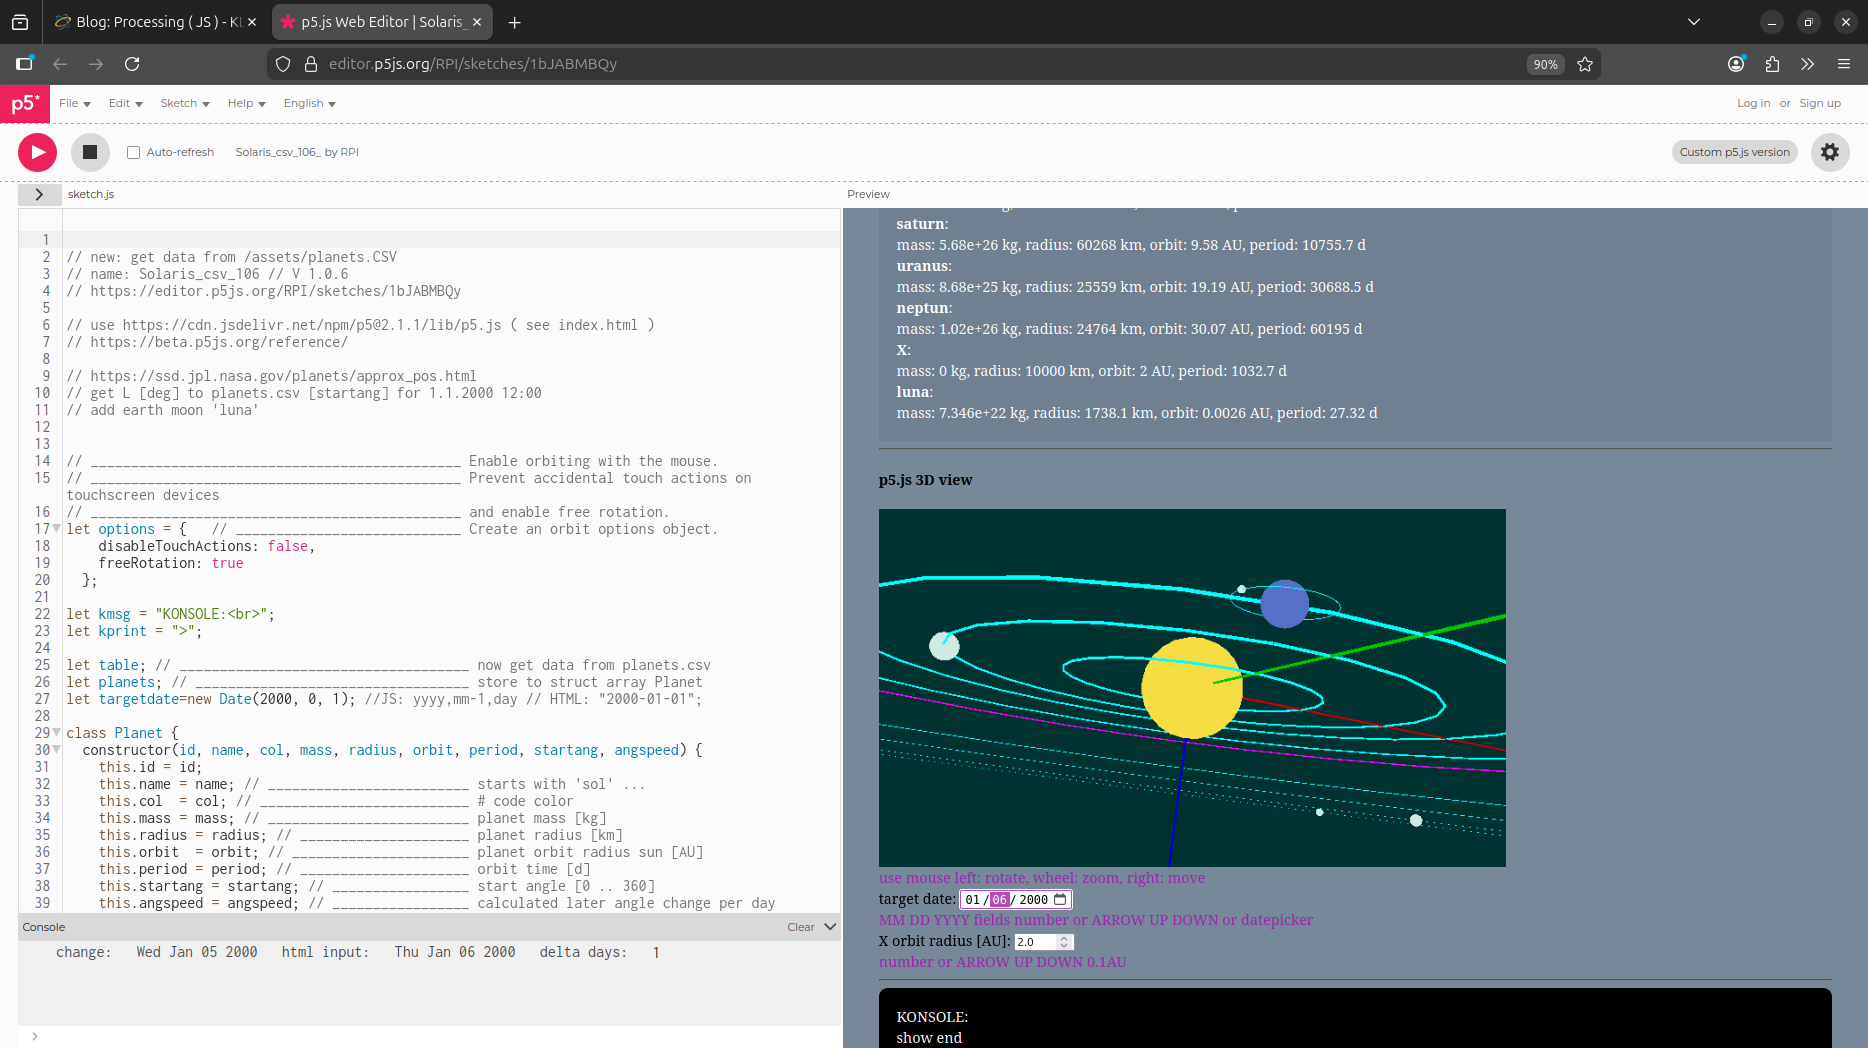
revision 1.0.3
i rewrite all by
get data from CSV
and save to a structured array
JS class
and used that data in loops over that array to create HTML content and CANVAS drawing,
if you check the source there will see, that that class has 2 procedures to do that jobs
see
online editor
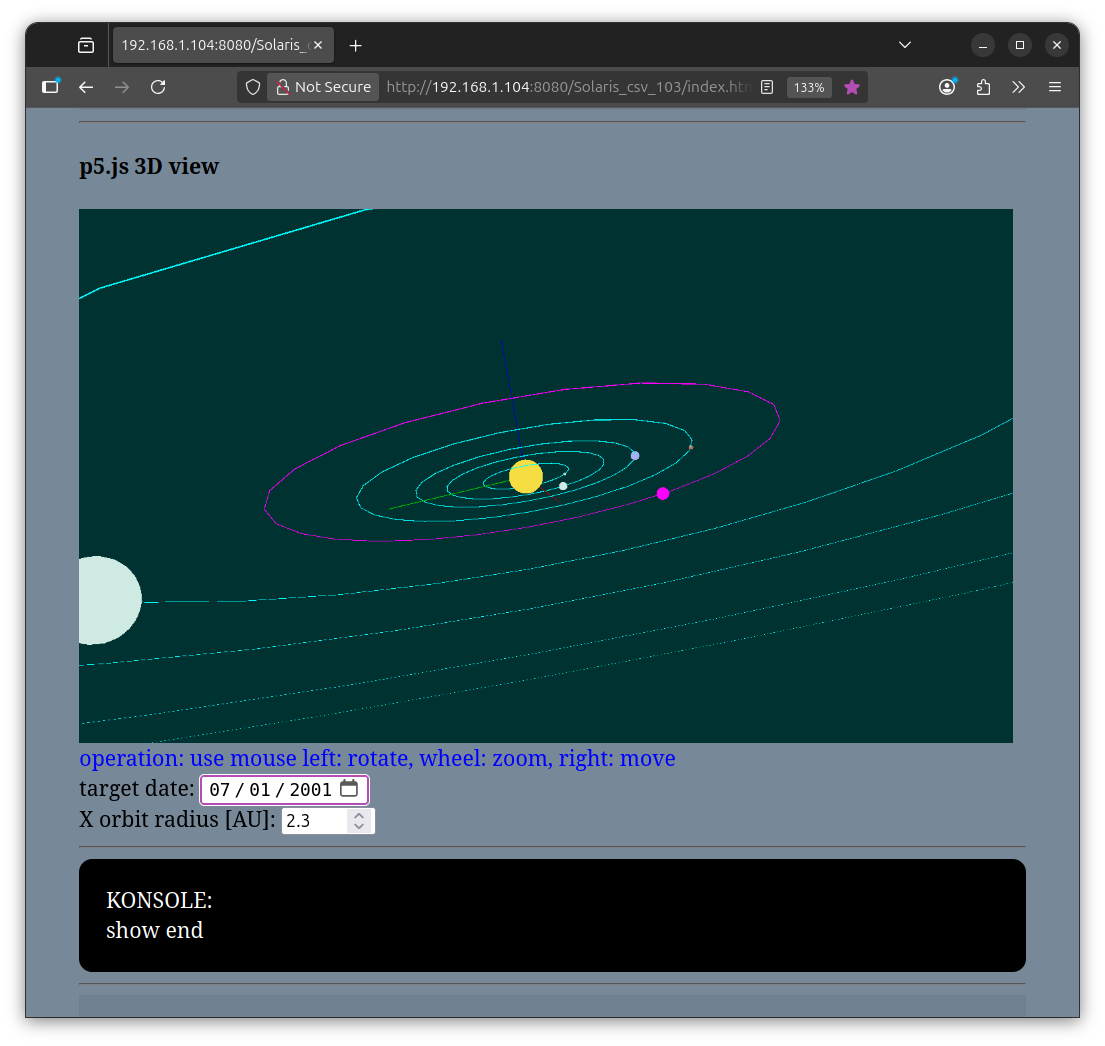
for fun added a planet 'X' where a HTML number input allows you to change the orbital radius for that planet ( 0.1 .. 30 step 0.1 [AU])
( and overwrite that planets array members orbit )
add show in a 'KONSOLE' recalculated orbital mechanics for it:
from center mass and orbital radius can calculate:
speed v = sqrt( G * CenterMass / Radius ) [m/s]
circumference s = 2 * PI * Radius [m]
orbit duration t = ( s / v )/(24*3600) [d]
below CANVAS that HTML area again is used for 2 more
of that calculations:
-e1- Earth Orbit SOL:
-e2- Earth satellite Geo-stationary Orbit:
also included a HTML DATE picker
where that astronomical start day is 1.1.2000
and from the orbit duration( days ) calculate a delta angle per day
so when the day change +- the planets will rotate..
and not just jump to new position...
after date change a SHOW starts moving in days.
ok, going to 2025 takes little bit long...
i have a problem when i download and upload to my local RPI4 nginx server
browser can not find the needed files ( table, font... )
but that is understandable:
http://192.168.1.104:8080/favicon.ico ( is missing anyway )
http://192.168.1.104:8080/assets/planets.csv
is wrong!
but
http://192.168.1.104:8080/Solaris_csv_103/index.html
ok and then finds sketch.js and style.css
but not the async loaded table planet.csv
ok, it works with abs path:
table = await loadTable('http://192.168.1.104:8080/Solaris_csv_103/assets/planets.csv', ',', 'header', loadData);
MY BAD
should be NO leading '/'
table = await loadTable('assets/planets.csv', ',', 'header', loadData);
but actually the
https://beta.p5js.org/reference/p5/loadtable/
shows it 'wrong'
update 16.11.2025:
p5.js had a mayor update, like 2.xx out of beta last week now 2.1.1
and i try that already in
Solaris 1.0.6
// add
earth moon 'luna'
by adding it manually in
index.html,
< script src="https://cdn.jsdelivr.net/npm/p5@2.1.1/lib/p5.js">< /script>
as today the editors version selector allows only up to 2.0.5
pls. check it out