
PROCESSING: 3.5D graph
50 PROCESSING: 3.5D graph
PROCESSING: 3.5D graph and EXCEL tool
as i not use MS EXCEL, more work online in google docs spreadsheet
or now test Open Office 4.0 calc
i miss 3D graphs.
after PROCESSING and CSV file store
i try to use PROCESSING to show the data ( i made with the included EXCEL file ( OO export ))
there are many online 3Dgraph/calc tools and also add in libraries
for processing available. but all work with a math. formula like i do in the excel tool.
But i did not find anything with the data import step inbetween, but that is essential to our
requirement if we want use measuring data ( like from arduino and catch the terminal stream to CSV file )
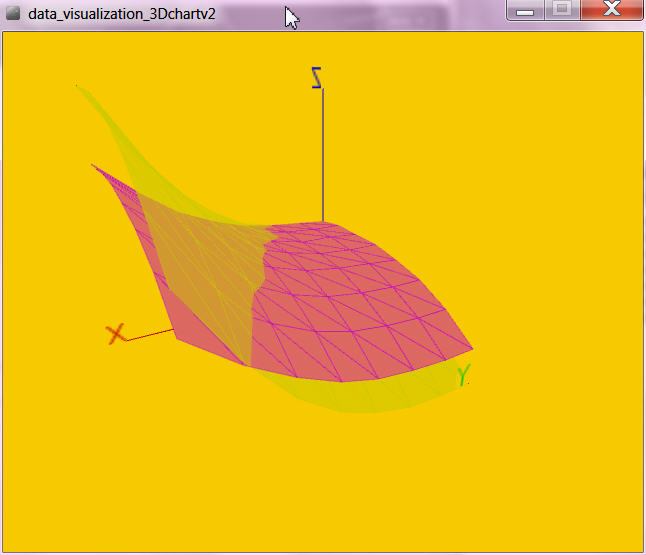
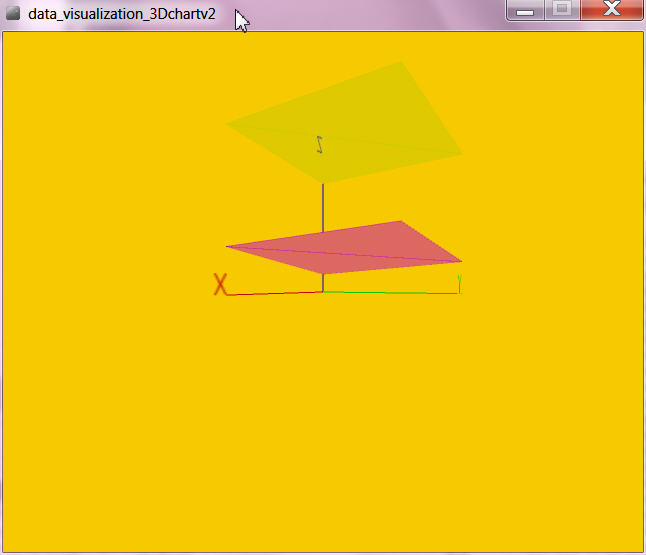
The plot has X Y Z axis, and 2 planes,
add options:
rotate and zoom with mouse
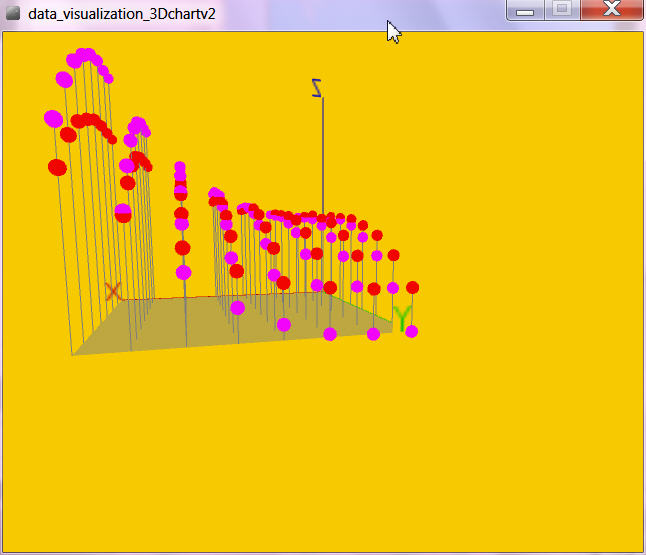
and show datapoints, bars, groundfloor.
data come from a CSV file with
N integer for planes
X,Y integer for axis
Z float for data, like minimum:
N,X,Y,Z
0,0,0,20.0,
0,0,1,30.0,
0,1,0,40.0,
0,1,1,50.0,
1,0,0,120.0,
1,0,1,130.0,
1,1,0,140.0,
1,1,1,150.0,
gives:
additional
the input data CSV file can be generated by a included spreadsheet
using a polynom
Z = f( X (N), Y(N) ) function = f(N) + f(X,N) + f(Y,N) + f(X,Y,N)
with
f(N) = a + v*N
f(X,N) = b*(X+o*N)**(c+w*N) + d*(X+p*N)**(e+x*N) + f*(X+q*N)**(g+y*N)
f(Y,N) = h*(Y+r*N)**(i+z*N) + j*(Y+s*N)**(k+A*N) + l*(Y+t*N)**(m+B*N)
f(X,Y,N) = n*(X+u*N)*(Y+u*N)
and each axis add has a linear equation for ranging prior to above calculation.
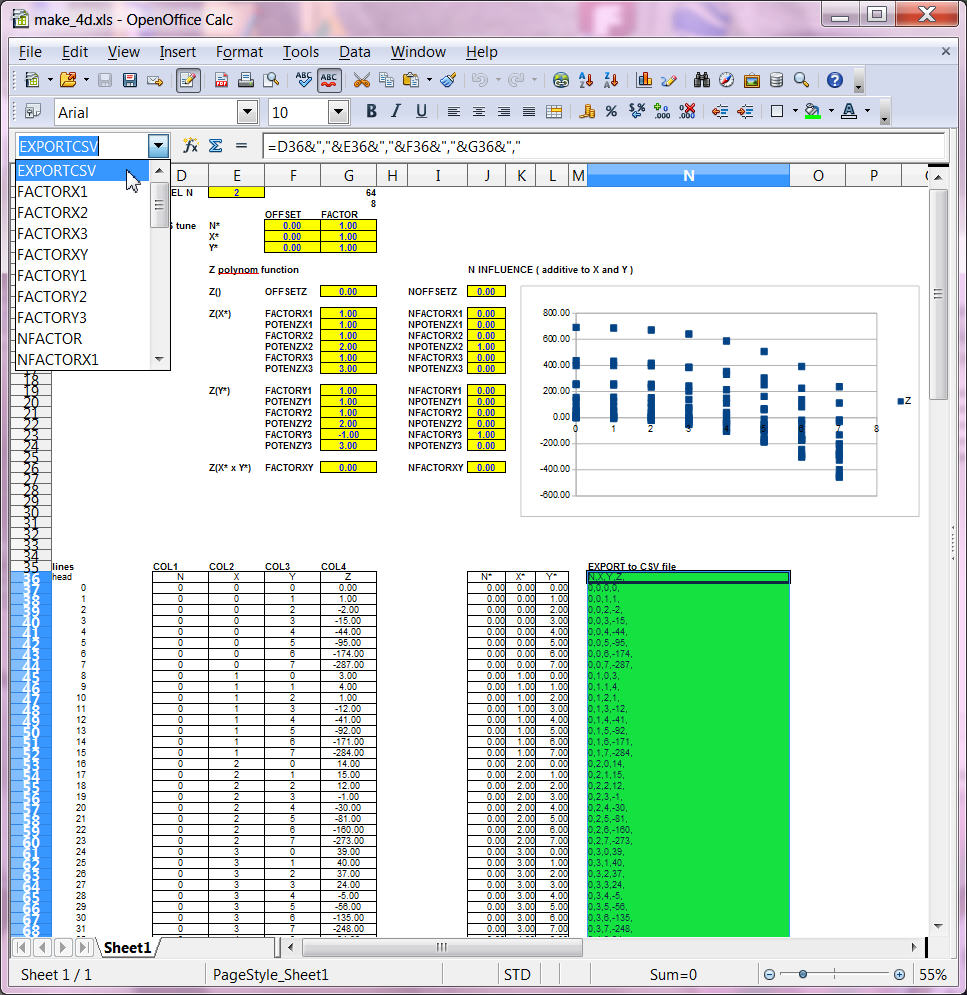
using named cells makes the formula ( for each Z cell ) easy:
=OFFSETZ+J38*NOFFSETZ+
FACTORX1*POWER(K38+NFACTORX1*J38;POTENZX1+NPOTENZX1*J38)+
FACTORX2*POWER(K38+NFACTORX2*J38;POTENZX2+NPOTENZX2*J38)+
FACTORX3*POWER(K38+NFACTORX3*J38;POTENZX3+NPOTENZX3*J38)+
FACTORY1*POWER(L38+NFACTORY1*J38;POTENZY1+NPOTENZY1*J38)+
FACTORY2*POWER(L38+NFACTORY2*J38;POTENZY2+NPOTENZY2*J38)+
FACTORY3*POWER(L38+NFACTORY3*J38;POTENZY3+NPOTENZY3*J38)+
FACTORXY*((K38+NFACTORXY*J38)*(L38+NFACTORXY*J38))
lucky that named cells and that ugly but still useful chart works in Open Office and EXCEL
after tuning you can select a named list:
EXPORTCSV
and use CTRL C (copy)
and open the 4D.CSV file ( also in the /data/ processing subdir ) with a text editor
select all ( old lines ),
paste new with CTRL V in and save.
then restart the processing tool.
and here code, data and xls file for download
NEXT on this CHANNEL:
use a arduino to measure and format the serial output to the requirements of above CSV file.
ARDUINO PROJECT: 3.5D datacollection